

First, thank you. Whether you’ve been following LobWedge from the start or just subscribed, it means a lot that you’re here. This update is a look under the hood at what the levels are actually doing in the market.
We’ve been publishing the ES Weekly Game Plan for three weeks now. That’s not a long time, and not enough to prove anything definitively. But there are early signals worth sharing about what’s working, what isn’t, and where this is headed.
For Anyone New
Every weekend, I publish a game plan for ES futures (the S&P 500 futures contract). The plan identifies specific price levels where I expect buyers or sellers to step in, a directional bias for the week, and three scenarios ranked by probability.
The market is an auction. Buyers and sellers negotiate price constantly, and certain prices matter more than others: where large volume traded before, where the market previously reversed, liquidity pockets, options weightings, and where fair value sits. I map those levels ahead of time so you know what to watch before the week starts.
You get the plan Sunday night. Set your alerts. When price hits a level during the week, you already know what to look for. No scrambling, no chasing.
Mid-week, I publish an update in case conditions have shifted. New levels get added, scenarios re-ranked, and the bias adjusted if the market tells us to pivot. Members also get direct chat access for real-time Q&A, plus stock ideas when individual name setups appear.
Early Results: The Levels Are Working
I ran the first three weeks of plans against real 1-minute market data, verified tick by tick. No cherry-picking, no hindsight adjustments.
29 trades across 15 trading days. Every time price touched a published level during regular trading hours (9:30am to 4:00pm ET), I tracked it as a trade. Entry at the level, hold to the 4pm close. Mechanical, no discretion.
Overall: 69% win rate, +207 ES points. Every level, every touch, no filtering.
When we separate the level types, the picture sharpens:
Buying the dips worked. Support levels (range lows and levels below) hit at 73% with +168 points across 11 trades. The “buyers should step in here” levels held.
Breakout levels were the weak spot. Buying at range highs hoping for continuation? 60% win rate but negative overall at -115 points. The Feb 12 selloff alone cost -126 points on a single breakout trade.
The best filter: skip the breakouts entirely. Trading only support levels, fair value bounces, and resistance fades produced 19 trades at 74% and +322 points.
I’m posting the interactive backtest chart alongside this piece. You can toggle between strategies and watch the numbers update live.
3 Weeks of Levels vs Price
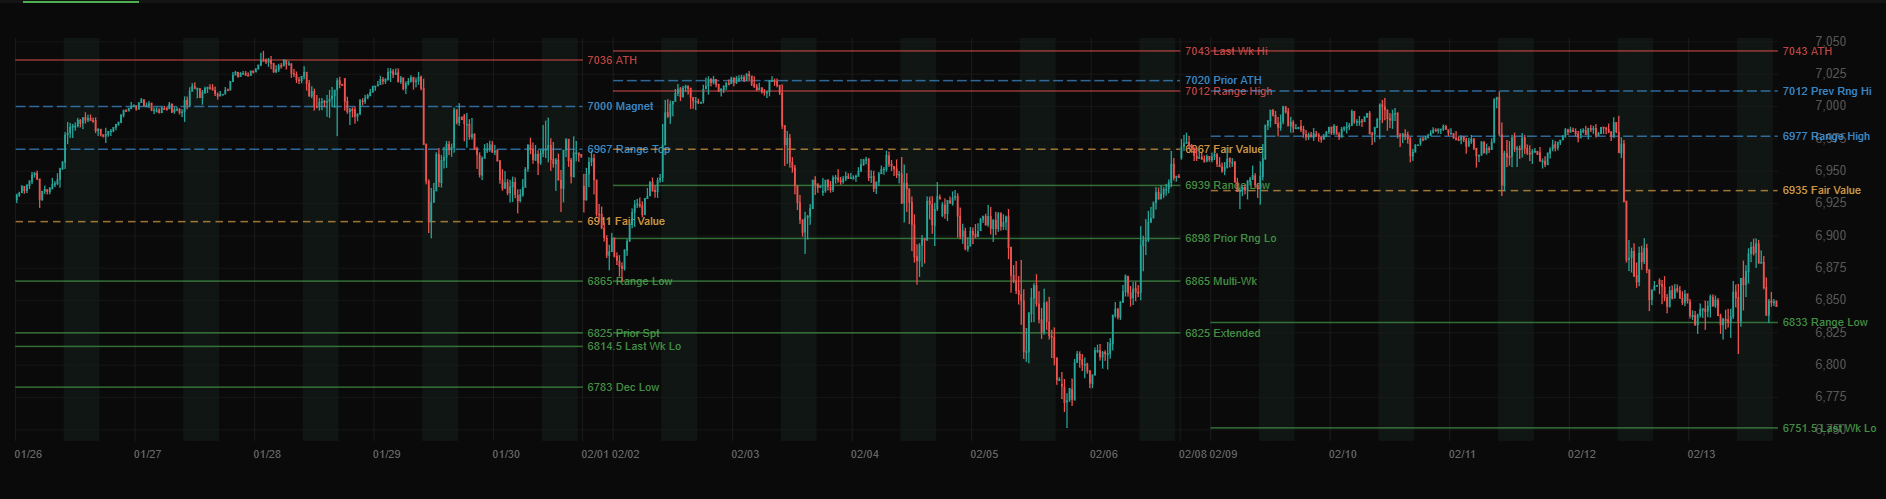
Every horizontal line is a level published in the weekly plan before the market opened. Green lines are support (buy zones), orange are fair value, blue are breakout levels, and red are resistance fades.
Context and Caveats
Three weeks is not a track record. It’s 29 trades, barely a statistical sample. The market was net bearish during this stretch, we only had 2 short trades, and one bad day (Feb 12) created a -210 point drawdown from peak.
What is meaningful: price reacted at the levels. That’s the core thesis. Auction/ options based levels, identified ahead of time, produce tradeable reactions. The data supports that so far. Not every time, not without pain, but consistently enough to build on.
These backtests cover regular trading hours only (9:30am to 4:00pm ET). Many levels get touched overnight during the Globex session. We’re tracking that, but for now the results reflect daytime entries only.
What We’re Exploring
The weekly plan and mid-week update are the foundation, but I’ve been prototyping in the background. Nothing to announce, still in the lab, but the direction is exciting:
We may just skip all this and just go full automation. I’m getting older and trading actively can be exhausting like a sport. I want to make all my experience packaged to be easier in the new frontier.. .. anyhow..
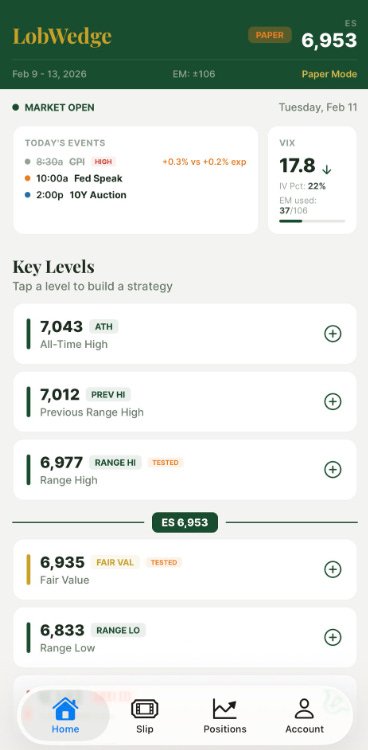
Mobile-first alerts and execution. Level alerts and position management from your phone. On the golf course, at lunch, wherever. The early prototype is working.
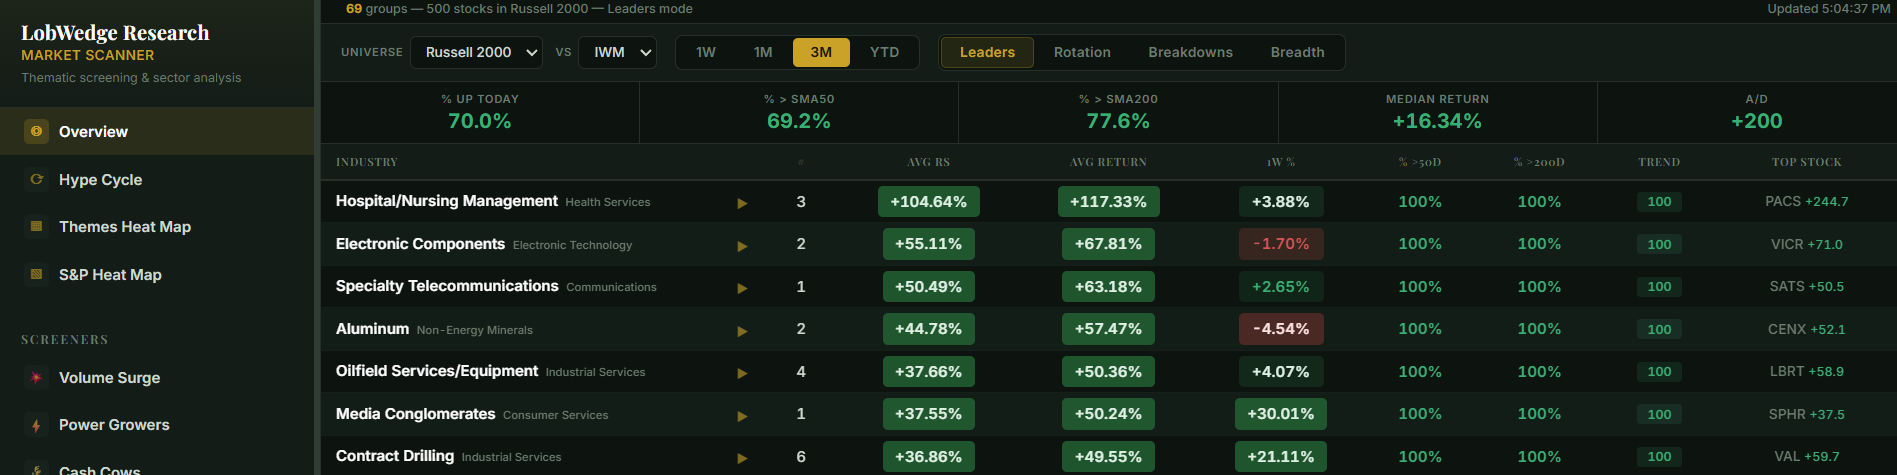
A stock scanner for dip-buying. When ES sells off and hits support, the best opportunities often show up in individual names. Building a scanner that surfaces ideas during pullbacks automatically.
Deeper backtesting. I want 6+ months across different market regimes (rallies, selloffs, chop) to pressure-test what holds up. NQ, sector analysis, and options setups around our levels are all on the whiteboard.
None of this is a promise. Just where the prototyping is headed and having fun building. You’ll be the first to know when something is ready.
The Bottom Line
We’re early. The results are promising but preliminary. The levels are producing real reactions, the support zones carry the strongest edge, and the breakout levels need work. Three weeks of data, not three years. But a solid starting point.
If you’re on the free list and curious about what paid members get: the weekly plan, mid-week updates, direct chat access, and stock ideas are all included at $49/month. We’re small on purpose right now, and the early members are shaping what this becomes.
Thank you for being part of it. Reply, DM, drop a comment. I read everything.
More to come.
— LobWedge Research
LobWedge Research is for informational and educational purposes only. Nothing published here constitutes financial advice, a recommendation to buy or sell any security, or an offer to provide investment advisory services. Trading futures and options involves substantial risk of loss and is not suitable for all investors. Past performance, including any backtest results discussed above, is not indicative of future results. Backtest results are hypothetical, do not reflect actual trading, and do not account for slippage, commissions, or market impact. Always do your own research and consult with a licensed financial professional before making any trading decisions. © 2026 LobWedge Research
Not to argue, but your post started with “early backtest results”. And yes, you have far more experience with me, sir. And that is why I have followed your posts for years and have chosen to subscribe.
What I was attempting to describe in my comment is that some of the stats are what they are, in part, because we have been in a range during these first three weeks. Rather than disparaging your analysis, I was attempting to emphasize a point that I was inferring from your post. I apologize if my comment was not clear, but that’s an unfortunate side affect of text-based communications.
I really am enjoying and am learning from your analysis.
Excellent summary. The backtest stats over these initial 3 weeks are likely impacted by our being in this recent range bound market (i.e, low success on breakouts, high success on retracements). If I recall we've been bouncing in a roughly 300 pt range. So when it does break, that could be a meaningful move. Have to respect the range for now and honor stops.