

ES weekly plan · November 8, 2026 · № 46
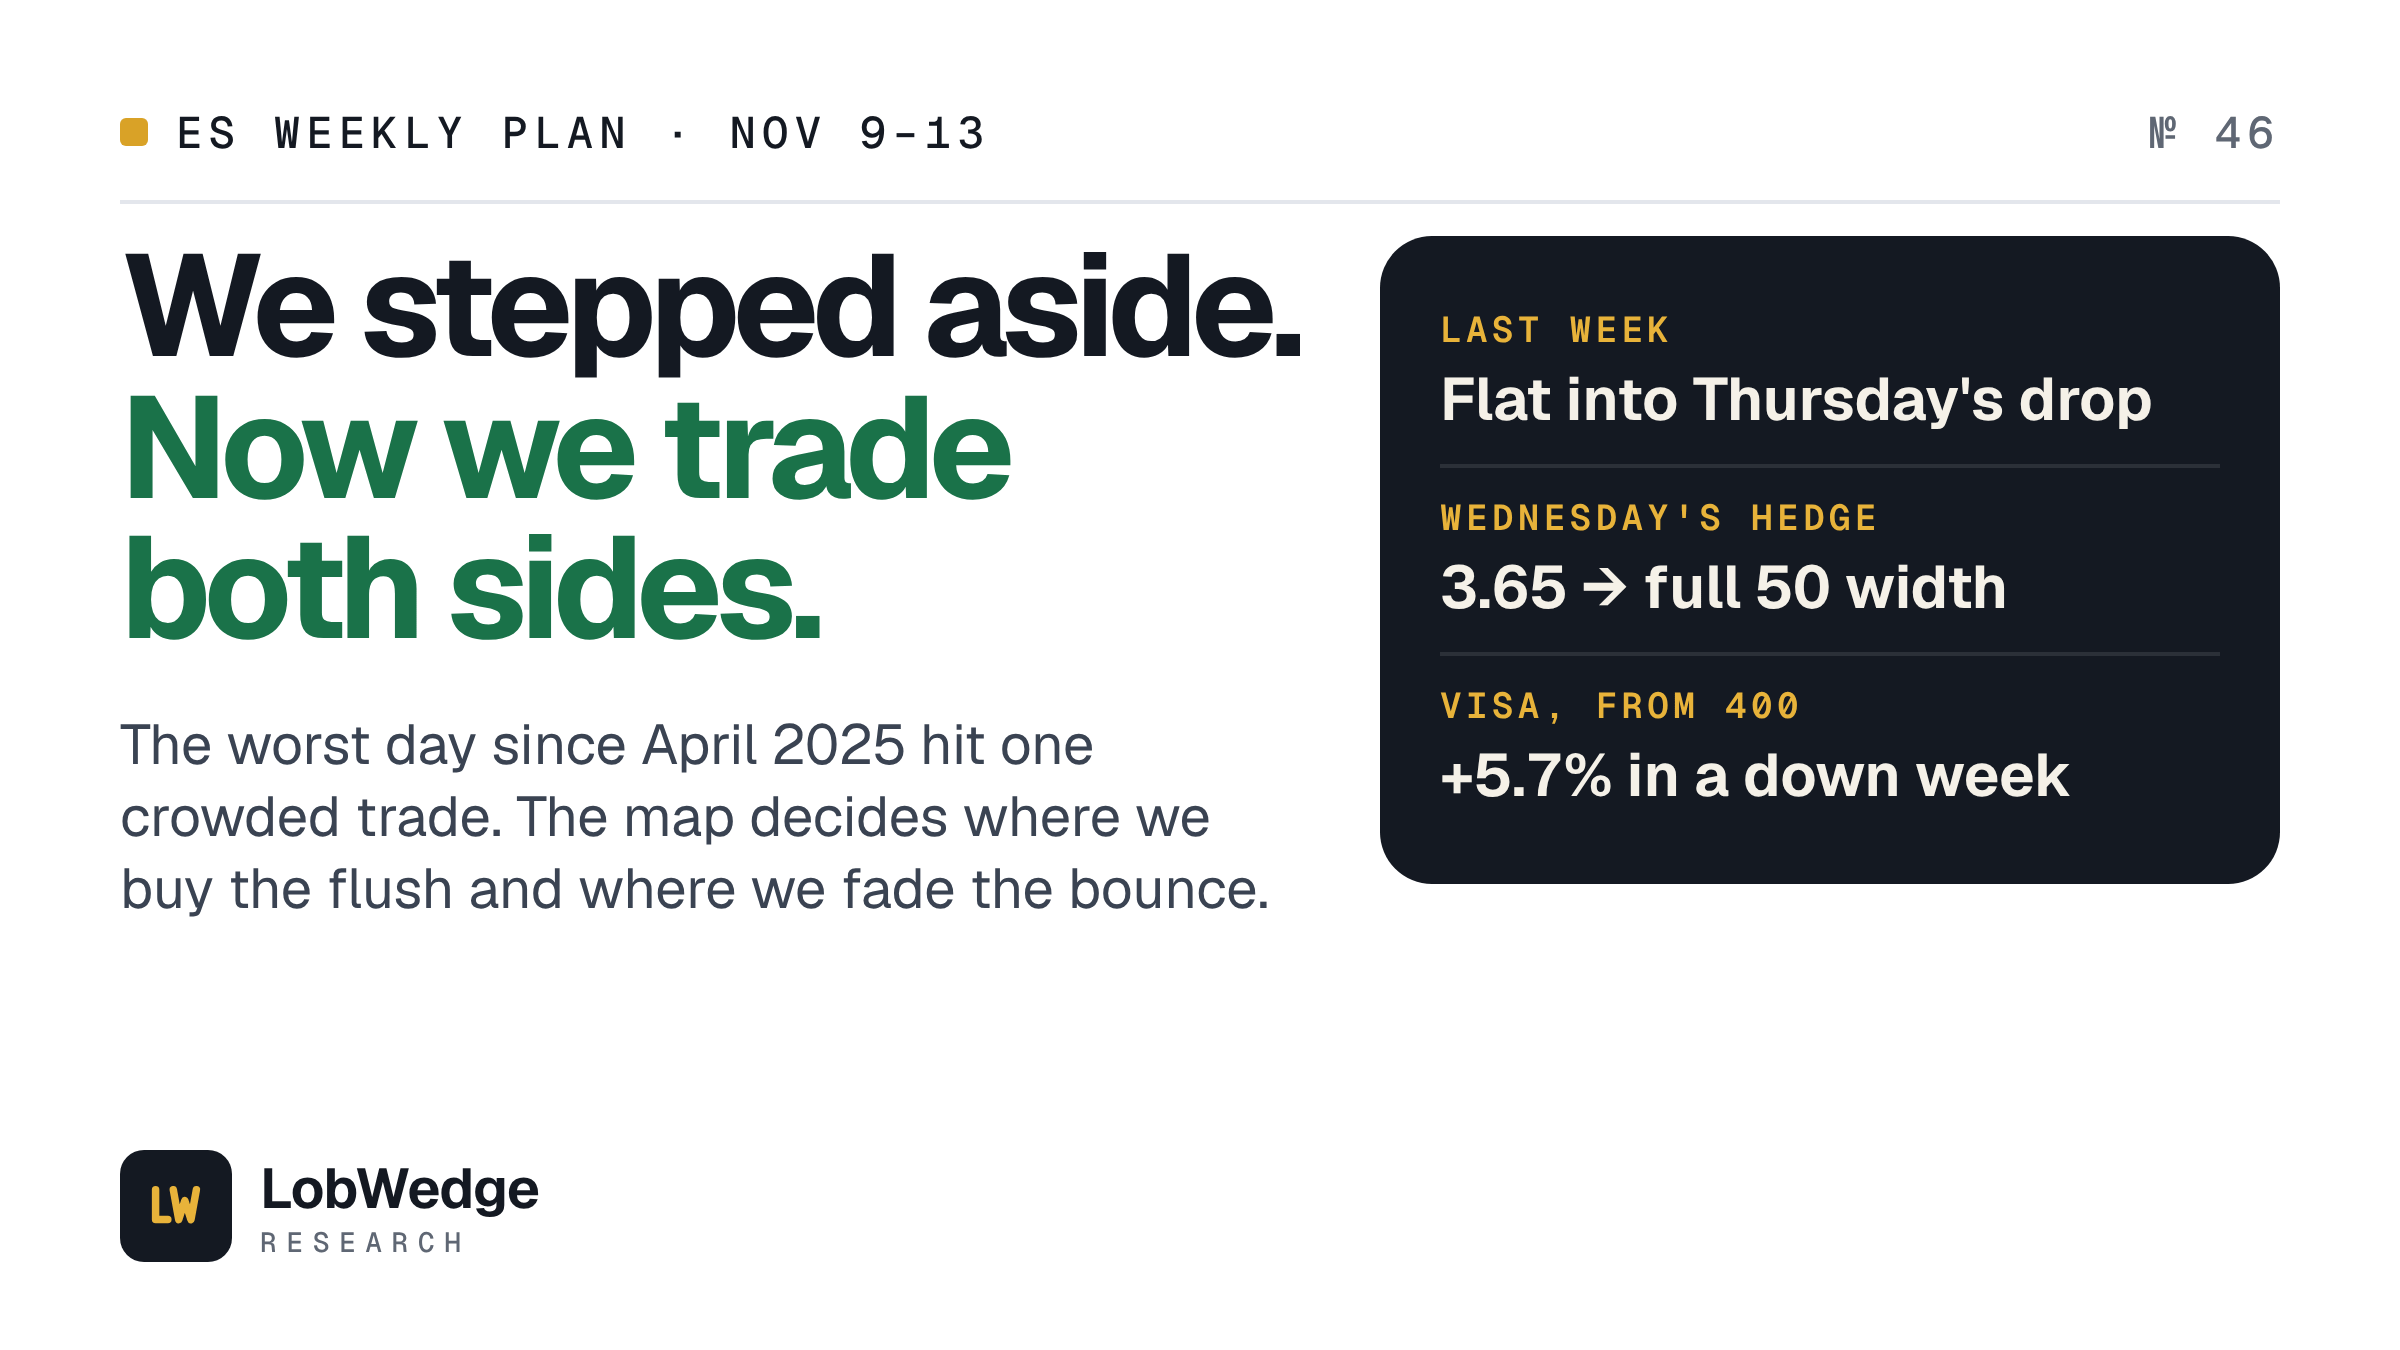
Last week’s map had a path for the break, and the rules kept us out of the worst of it. Sunday’s plan gave 33% to “lose 7,538, test lower,” and that’s the one that played: ES closed Friday 134 pts under 7,538. Wednesday’s buy at 7,714 needed a hold and never got one, so we were flat into Thursday’s drop. The hedge in Wednesday’s note, the SPX 7,600/7,550 put spread at about 3.65, settled at its full 50 width two days later. Visa (V) is up 5.7% from our 400 buy.
ES settled 7,404, down 210.50 on the week. Thursday’s 4.4% drop in the S&P 500 was its worst day since April 2025, the chip index fell 12%, and VIX closed at 28.18. Friday bounced on a payrolls beat and stalled right where this week’s map starts.
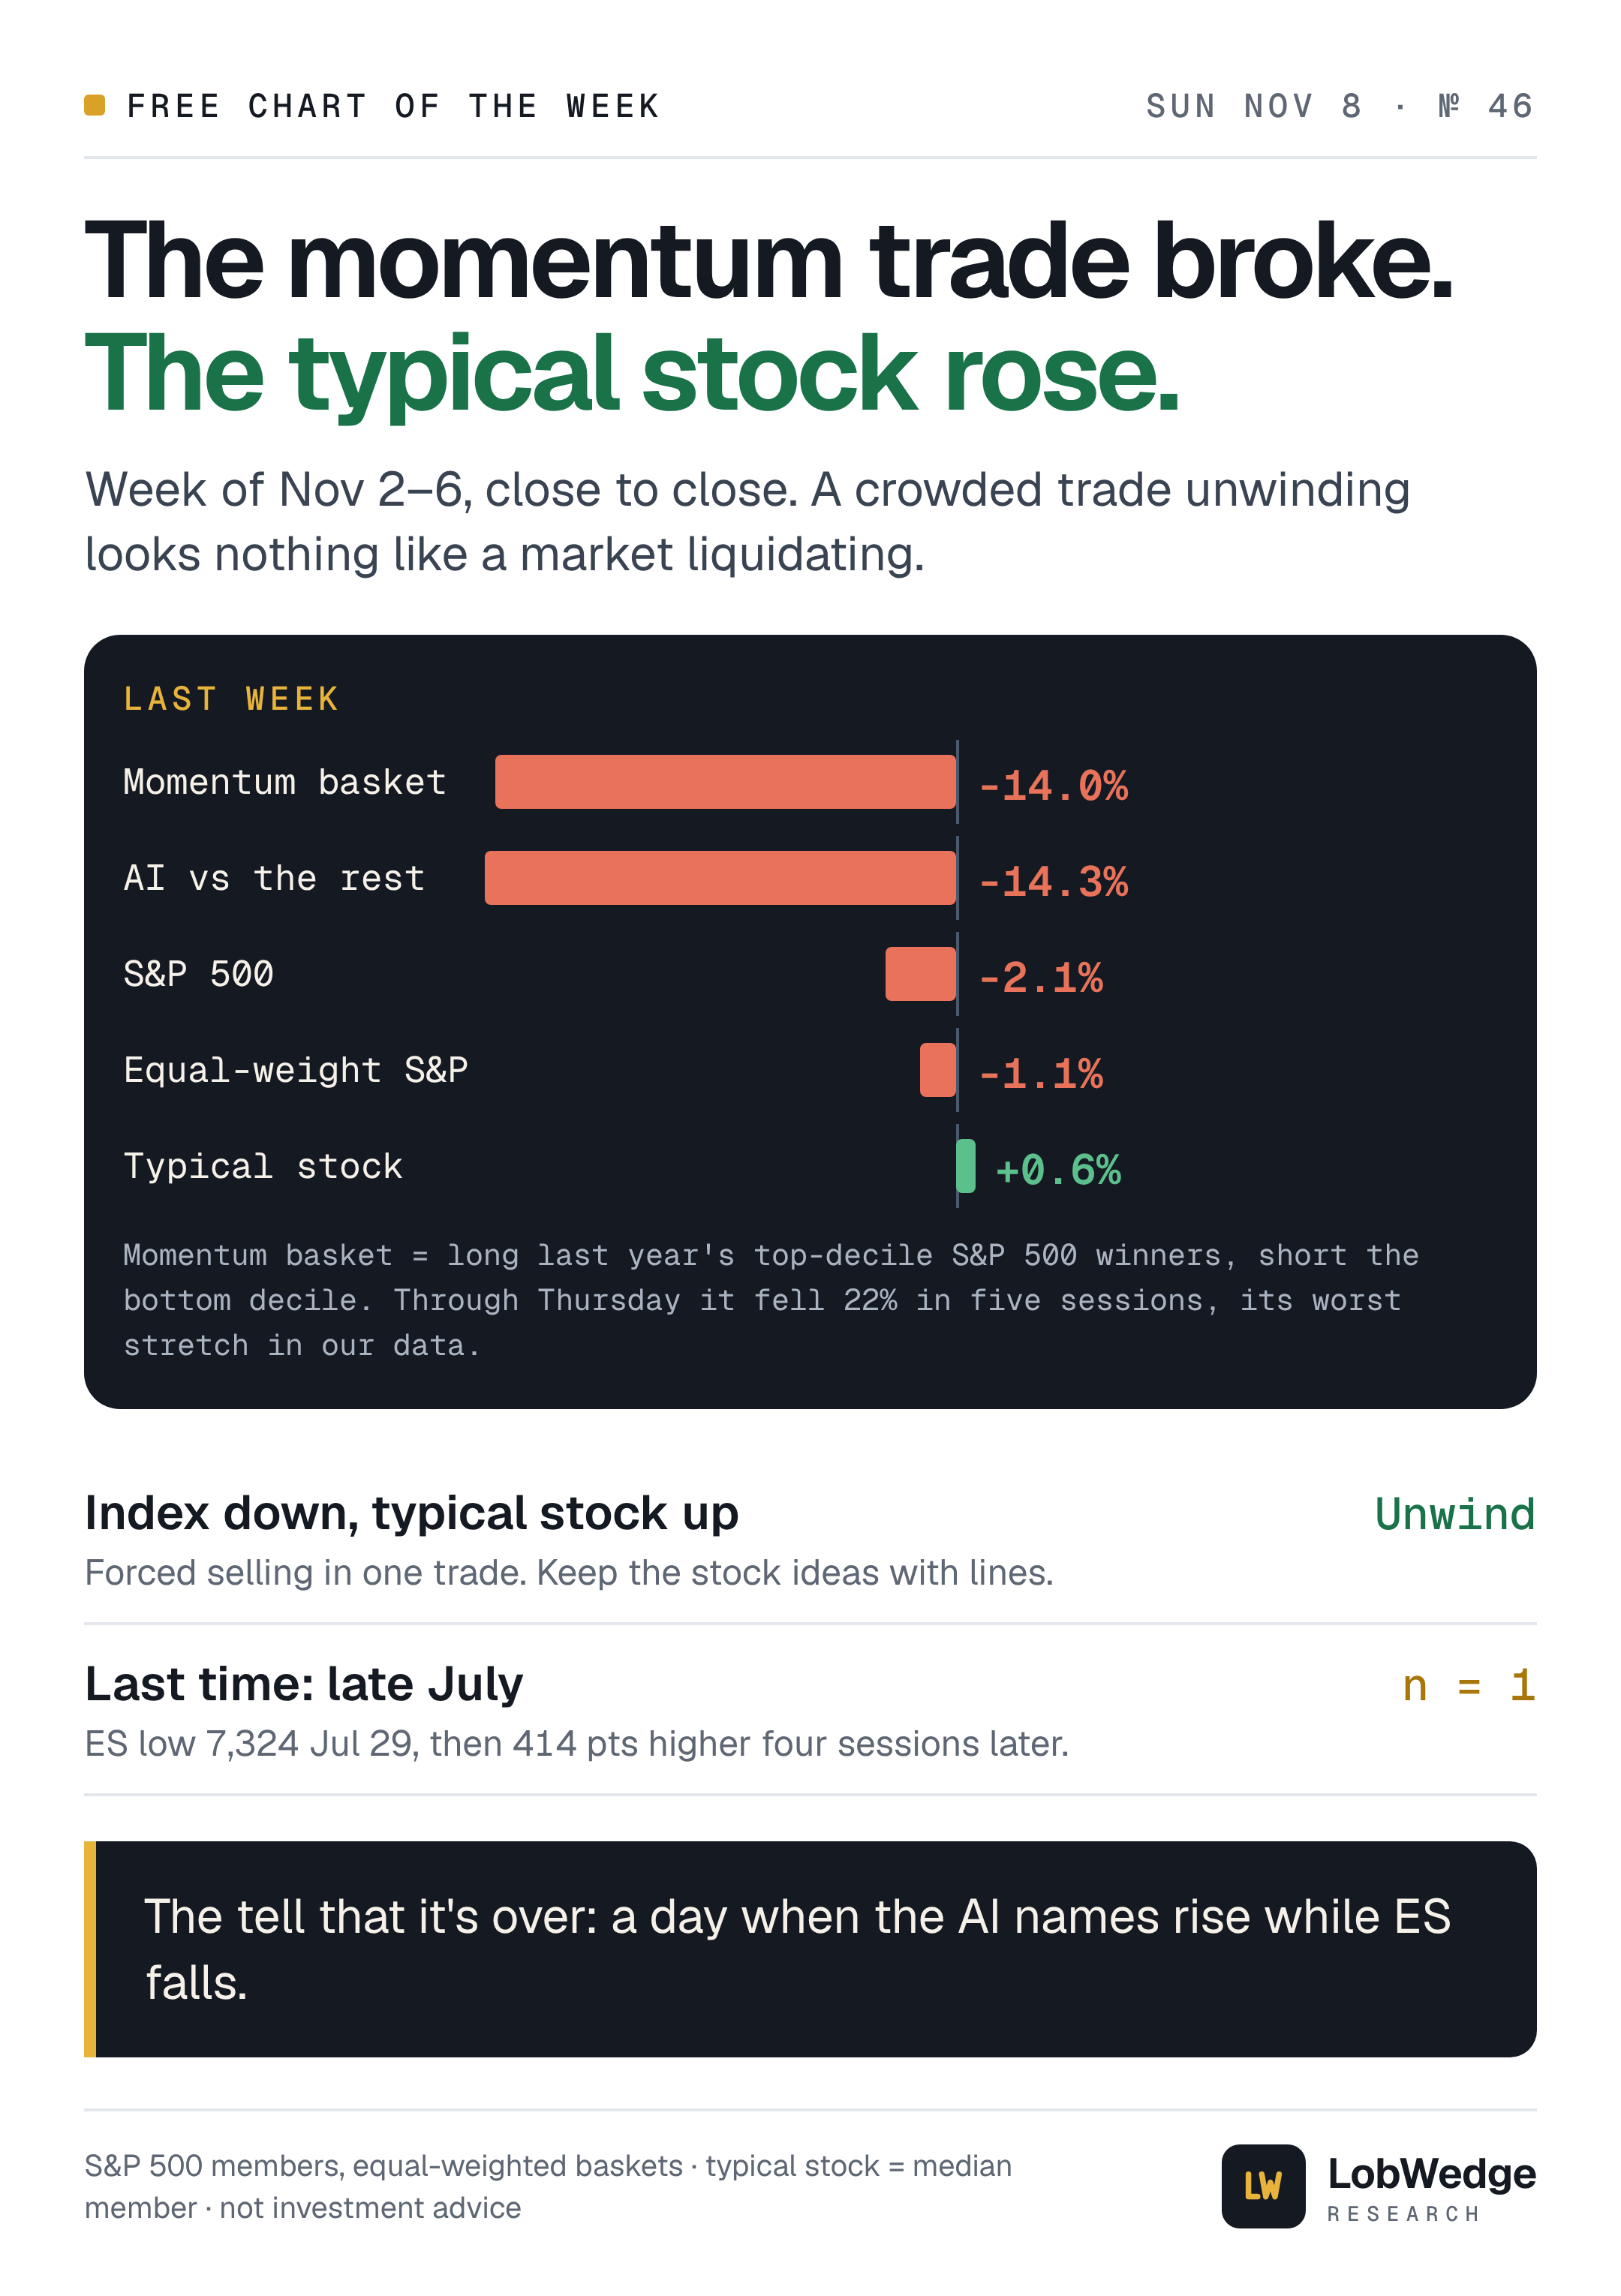
The headline number hid the real story. On our build of the S&P 500 members, the typical stock rose 0.6% on the week, while a basket long last year’s winners and short its losers lost 14%. Over the five sessions through Thursday that basket fell 22%, its worst stretch in our data. That’s a crowded trade unwinding, not a market liquidating. 60% of S&P 500 stocks still sit over their 200-day.
Free chart of the week: the momentum crash and the typical stock. Forced selling in the AI winners dragged the index. The last time this basket broke this hard was late July. ES made a 7,324 low on Jul 29, closed at 7,472.50 the next day, and was 414 pts over its Jul 29 close four sessions later. One case isn’t a pattern. If forced sellers are done, the bounce can come fast. If they aren’t, a rally that stalls at the first line is the fade.
Below the line: the grades, the score, this week’s map and odds, two trades priced at their levels, three asymmetric setups, and two long-term builds the selloff made cheap.
