

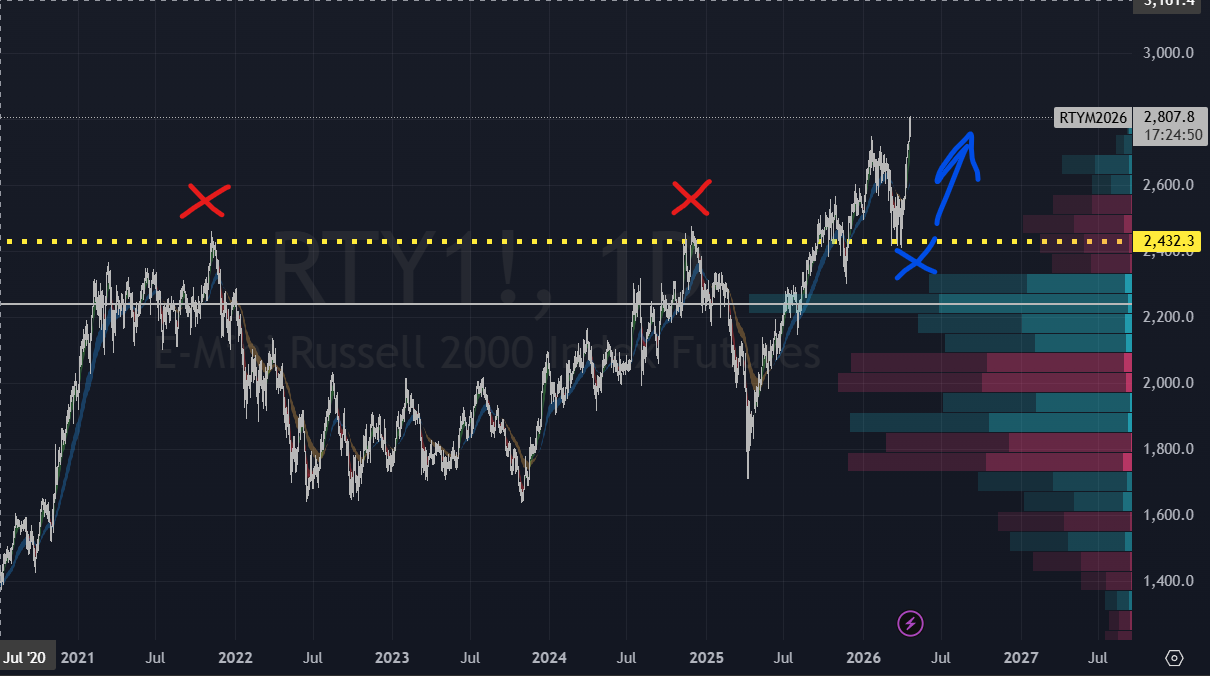
RTY has been stuck in a range with a ceiling near 2,432 since late 2021. Two clean breakout attempts. Two failures. Each one rejected at the same horizontal resistance, absorbed by overhead supply built across half a decade of trading.
The third attempt cleared it.
Russell 2000 futures are trading 2,809 as of last week. All-time highs. Best month since December 2023, up 11.7% in April. The snapback test already happened. The blue X on the chart. Price pulled back toward the breakout zone earlier this year and bounced. The retest held. Classic.
The old technician’s rule: the longer the base, the further the space. A four-year range with a measured move that targets the 3,200-3,300 area. That’s roughly 15% from here. Look at the volume on the right side of the chart. Heavy volume clustered in the 1,800-2,200 zone, thin air above 2,432. Once through the ceiling, there’s nothing to stop it.
But there’s a problem.
The Trap Door
Roughly 40-46% of Russell 2000 companies are unprofitable. That’s the highest share since COVID and roughly double the 2008 level. About 32% of the index’s debt is floating-rate, compared to 6% for the S&P 500. And $368 billion in debt matures this year alone, part of a $1.35 trillion wall hitting between now and the end of 2027.
Companies that borrowed at 1-2% in 2021 are refinancing at 6.5-8%. For the weakest names, that’s not a headwind. That’s a death sentence.
So the breakout is real. But buying the index means buying the survivors and the zombies in the same basket.
The Leaders Are the Breakout
Profitable Russell 2000 stocks are up roughly 8% year-to-date. Unprofitable names are flat to negative. This is not a rising tide. The breakout is being manufactured by a specific group of companies, and if you don’t own them, you don’t own the move.
That’s why we care about relative strength right now. It’s not a momentum screen. It’s a map of who is actually carrying the index through four years of overhead supply. The names at the top of the RS rankings are the breakout. Everything else is along for the ride, or dead weight dragging the index down.
If this move is real, these leaders will keep leading. If it fails, they’ll be the last to roll over and the first to tell you. Either way, the signal comes from the same place.
The Filter
We ranked every Russell 2000 stock by year-to-date relative strength and filtered for profitability, domestic revenue, and structural tailwinds. The winners cluster into five structural themes, plus a sixth high-beta layer in biotech. All five structural themes are ones we’ve been tracking at the large-cap level all year. The rotation is confirming down the cap stack.
Semi Reshoring
The same CHIPS Act fab buildout cycle that’s driving MU, AVGO, and LRCX at the large-cap level has a small-cap layer underneath it. 19 semi names land in the top 100 of the Russell 2000 by YTD performance. No other theme comes close.
Aehr Test Systems (AEHR), up 347% year-to-date. Tests silicon carbide and gallium nitride wafers. Every new fab that comes online needs test infrastructure. The #3 ranked stock in the entire Russell 2000.
Ichor Holdings (ICHR), up 250%. Fluid delivery systems for semiconductor fabs. When TSMC, Intel, or Samsung build, Ichor supplies the plumbing. #7 in the index.
Alpha and Omega Semiconductor (AOSL), up 101%. Power semiconductors for computing, consumer, and industrial. Riding the same power delivery cycle that’s lifting the large-cap analog names.
SkyWater Technology (SKYT), up 84%. The only pure-play US-owned domestic semiconductor foundry. TRUSTED certification from the Department of Defense. When people talk about reshoring semiconductor manufacturing, SKYT is the company that’s actually doing it.
Ultra Clean Holdings (UCTT), up 214%. Precision parts and cleaning for semiconductor fabs. Every wafer process step needs UCTT’s contamination control. #8 in the index.
FormFactor (FORM), up 158%. Probe cards and test infrastructure for advanced chip packaging. The bridge between design and production for every leading-edge node. #14 in the index.
Behind these six: DIOD, COHU, NVTS, KLIC, TTMI, MXL, VSH, AEIS, POWI. The bench runs deep. This is the dominant theme in the Russell 2000 breakout.
Critical Minerals and Materials
Supply constrained by geopolitics, no quick fix. China controls processing for most of what the US needs. The small-cap layer:
United States Antimony (UAMY), up 112%. The only domestic US antimony producer. China controls 48% of global production. UAMY is the onshore alternative.
USA Rare Earth (USAR), up 90%. Domestic rare earth processing. The same supply chain vulnerability that drives the large-cap critical minerals thesis.
Tronox (TROX), up 124%. Titanium dioxide production from mineral sands. Vertically integrated mining to finished product. The highest RS materials name in the index.
Chemours (CC), up 98%. Specialty chemicals and titanium technologies. Broad materials exposure with industrial and construction end markets.
Defense and Space
BlackSky Technology (BKSY), up 100%. Space-based intelligence and analytics. Government and defense contracts. Real-time geospatial data for national security.
Vicor Corporation (VICR), up 105%. High-performance power modules for defense systems, data centers, and EVs. Power delivery is a bottleneck for every next-gen platform. Vicor solves it.
ViaSat (VSAT), up 86%. Satellite communications for defense and commercial. The connectivity layer for military operations and remote infrastructure.
Intuitive Machines (LUNR), up 70%. Lunar landers and space services. NASA contracts. The commercial space infrastructure play with government backlog.
Satellogic (SATL), up 258%. Sub-meter resolution Earth observation satellites. Government and commercial imagery contracts. The lowest-cost high-resolution satellite constellation in orbit. #6 in the index.
Planet Labs (PL), up 90%. Daily global imaging from the largest satellite fleet in history. Defense, agriculture, and climate monitoring. The data layer for every geospatial intelligence application.
Infrastructure and Power
Bloom Energy (BE), up 151%. Solid oxide fuel cells for distributed power generation. Data centers and industrial customers need reliable onsite power. The highest RS infrastructure name in the index.
Powell Industries (POWL), up 127%. Electrical equipment for energy, industrial, and utility customers. Domestic infrastructure spending flows directly through POWL’s order book.
Argan (AGX), up 95%. Power plant construction and industrial services. When new generation capacity gets built, Argan builds it.
Modine Manufacturing (MOD), up 88%. Thermal management solutions for data centers, EVs, and industrial applications. Heat is the constraint for every high-power system. Modine manages it.
Amprius Technologies (AMPX), up 149%. Silicon anode lithium-ion batteries with the highest energy density in production. Defense, aviation, and EV applications. The next-generation battery chemistry already shipping to customers. #19 in the index.
Data Infrastructure
Applied Optoelectronics (AAOI), up 369%. Fiber optic transceivers for data centers and cable TV. The #2 ranked stock in the entire Russell 2000 by relative strength. When hyperscalers upgrade their interconnects, AAOI supplies the optics.
Viavi Solutions (VIAV), up 150%. Optical test and measurement for fiber networks and data centers. Every network upgrade gets tested with Viavi equipment.
ADTRAN (ADTN), up 103%. Fiber and broadband networking equipment. Every fiber buildout, every broadband expansion runs through equipment like ADTRAN’s.
DigitalOcean (DOCN), up 86%. Cloud infrastructure for developers and small businesses. The cloud compute layer below the hyperscalers.
TSS Inc (TSSI), up 107%. Data center solutions and infrastructure services. Direct beneficiary of the AI-driven buildout at the facility level.
Biotech (High-Beta Layer)
This one is different from the five themes above. Biotech is not a structural tailwind trade. It is a catalyst-driven, high-beta layer sitting on top of three macro forces: the patent cliff ($200 billion in branded drug revenue at risk between 2025 and 2030, which forces large pharma into M&A), rate cuts favoring long-duration assets with no near-term earnings, and FDA reform accelerating approval timelines.
XBI is confirming. The biotech ETF broke out of its own multi-year base in April. These four names rank in the top 50 of the Russell 2000 by relative strength. ERAS leads the entire index. But biotech is binary. Clinical data hits or it doesn’t. M&A bids land or they don’t. Size accordingly.
Erasca (ERAS), up 484%. RAS-targeted cancer therapies with best-in-class clinical data across multiple tumor types. JPMorgan overweight. The #1 ranked stock in the entire Russell 2000 by YTD performance, and the highest weighted alpha on the list. This is not a spike. The momentum is accelerating.
Spyre Therapeutics (SYRE), up 124%. Next-generation biologics for inflammatory bowel disease. Differentiated antibody engineering. #26 in the index.
Dianthus Therapeutics (DNTH), up 123%. Complement pathway inhibitor for autoimmune diseases. Clinical data readouts ahead. #28 in the index.
Twist Bioscience (TWST), up 95%. Synthetic biology platform. Manufactures synthetic DNA for pharma, industrial biotech, and data storage. The raw material supplier for the entire genomics supply chain. #42 in the index.
The Valuation Case
The Russell 2000 trades at a forward P/E around 18x. The S&P 500 sits near 26x. That’s a 30%-plus discount, the widest gap in 25 years (Siblis Research).
Consensus earnings growth for the Russell 2000 is 18-35% for 2026. The S&P 500 is projected at 10-15%. Double the growth rate at a 30% discount to the multiple. The last time the valuation gap was this wide with a similar earnings growth differential was 2000-2001. What followed was six years of small-cap outperformance (Royce).
Goldman’s research team wrote that small caps have historically outperformed the S&P 500 by approximately 12% in the year following rate cuts.
What Has to Go Right
Three things.
The Fed stays accommodative. Funds rate at 3.50-3.75% has been the oxygen. If they cut again, small caps are the most leveraged equity trade to rate relief. Even holding steady is fine for the quality names that carry fixed-rate debt.
Earnings growth materializes. 18-35% consensus growth has to show up in actual reports, not just estimates. The semi equipment and critical mineral names have visible backlogs. The speculative biotech cohort does not. The filter matters.
Credit markets stay orderly. The maturity wall doesn’t need to disappear. It just needs to be manageable. If spreads blow out, even quality names get hit in the cross-selling.
What Kills It
Rate cut expectations collapse. Polymarket currently prices zero Fed cuts as the most likely 2026 outcome at 35%, with one cut at 31%. If rates stay higher for longer, the floating-rate debt burden becomes a body count. The March correction was a preview.
The maturity wall accelerates. $368 billion due this year. If a cluster of defaults hits a key sector, contagion selling doesn’t discriminate between quality and junk. Index-level ETF outflows drag everything down.
Earnings disappoint. If 18-35% growth was the estimate and 8-10% shows up, the valuation discount stops looking like an opportunity and starts looking justified. The quality filter only works if quality delivers.
The Trade
The breakout is real. Four years of accumulated supply absorbed. Snapback test held. Measured move target 15% higher. Thin air above the breakout zone on the volume profile.
The valuation discount is real. 30% cheaper than large caps with double the growth rate.
But 40% of the index is dead weight. The breakout works if you filter for quality. The names that work are the same themes we’ve been tracking all year at the large-cap level: semi reshoring, critical minerals, defense and space, infrastructure and power, data infrastructure. Biotech adds a high-beta layer on top, driven by patent cliff M&A and rate sensitivity. The rotation is confirming down the cap stack.
The risk is the Fed and the refi wall. Both are knowable, trackable inputs. Not guesses.
I’ll be watching these names week to week. If they start breaking structure or the credit picture deteriorates, I’ll flag it. The chart says go. The fundamentals say be selective.
Watchlist: AEHR, ICHR, AOSL, SKYT, UCTT, FORM, UAMY, USAR, TROX, CC, BKSY, VICR, VSAT, LUNR, SATL, PL, BE, POWL, AGX, MOD, AMPX, VIAV, ADTN, DOCN, TSSI, AAOI, ERAS, SYRE, DNTH, TWST
LobWedge Research provides market analysis and educational content only. Nothing here is investment advice. All trading involves risk. Do your own research and consult a licensed advisor before making any decisions. The author may hold positions in securities mentioned.