

For months the price action has had a mechanical feel to it. Dips that get bought before they can deepen. An index that stays calm while single names swing hard. Weakness that keeps punishing anyone who sells it. When a tape behaves the same way over and over, that’s usually not sentiment. That’s structure.
Late last month, Citadel Securities published its mid-year market structure review. They execute roughly 35% of all US retail volume, so this is the order book talking, not a survey. And it confirms what the tape has been hinting all year: the plumbing changed. Ten stocks are almost 40% of the S&P 500. A record wall of automatic money buys every dip. Half the options market expires within days.
Ten numbers tell the story. Each one carries an edge.
1. The S&P 500 is basically ten stocks now
The ten largest companies are 38.6% of the index, up from 25.6% in June 2020. Nearly two of every five dollars in your index fund now sit in just ten names. Semiconductors alone are 19.7%, the highest share ever and four times their 2020 weight. NVIDIA (NVDA) is the biggest stock in the world at 8.2%, and Micron (MU) just cracked a top ten that used to hold Johnson & Johnson (JNJ) and JPMorgan (JPM).
So your index fund, your tech names, and your chip trades aren’t three positions. They’re one position, three times. Size them as one bet, and treat semi headlines as index events, because that’s what they are now.
2. A trillion-dollar autopilot is buying every week
ETFs took in $1.2 trillion in six months, 45% ahead of last year’s all-time record and roughly 2.5x what used to count as a good full year. That works out to nearly $10 billion of buying every trading day.
And that money doesn’t read headlines. It’s paychecks, retirement contributions, and auto-invest settings, and it buys on schedule whether the news is good or bad. This is why pullbacks keep finishing shallower than everyone expects: it’s not complacency, it’s mechanics. Stop waiting for the flush the old market used to give you.
3. Retail is front-running your dip buy
On days the S&P falls, retail buys 3.5x its normal daily amount, the heaviest dip-buying ever recorded. June 12 was the biggest single day of retail net buying in history, beating the old record by 50%.
The better price you’re waiting for is being bought before it gets to you. We’ve watched this play out at our own levels for weeks: just last week ES printed its low within two points of our mapped floor and reversed more than 150 points off the line. The lesson we’ve been forced to learn twice this summer is that the first test of a good level is the fill. Waiting for deeper prices in a tape with a buyer this heavy just leaves points on the table.
4. And they’re nowhere near out of money
Household cash just hit 8% of total financial assets, a 30-year high, even with stock ownership at records.
Don’t short “exhaustion” that has a funding source. This behavior can persist far longer than feels reasonable, because the tank behind it is full.
5. A third of the options market expires today
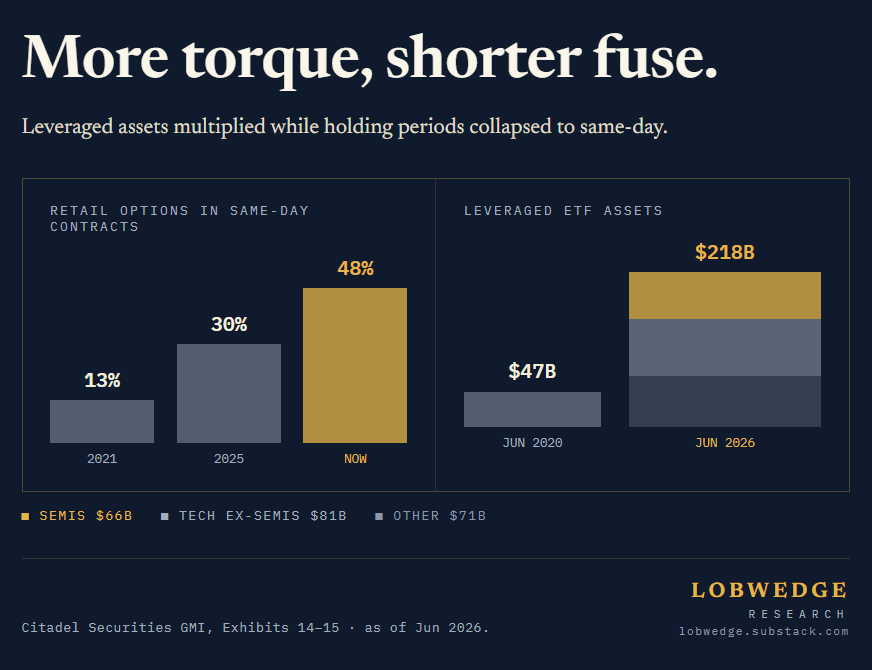
One in three options traded in the US now expires the same day. Nearly half of retail options volume is same-day, up from 13% in 2021. Picture a contract bought at 9:40 that’s dead by 4:00. That’s a third of the entire market now.
Positioning that used to build over quarters now resets overnight. Trends run further than the old rules allow, and reversals show up as gaps, not warnings. Defense in this market is a stop and a real hedge, not a feel for the turn.
6. The leverage is stacked on the most crowded trade
Leveraged ETF assets hit $218 billion, up 60% since March alone, with the semiconductor versions growing 175%. On top of that, retail traded a record $6.8 billion of options premium per day in June, nearly $2 billion of it in chip names, 75% in calls. And it isn’t just retail: the institutional consensus is the same trade. Morgan Stanley’s and BlackRock’s published mid-year top views both lead with overweight US equities and the AI complex.
There’s a mechanical edge buried in this one. Leveraged funds are a crowd that’s required, by design, to press whatever the day already did: up days force them to buy more into the close, down days force them to sell. At $218 billion, that closing flow is real size, and it’s completely price-insensitive. Three things follow. Trend days tend to finish at their extremes, so don’t fade a strong close. An acceleration lower in the last hour of a red day is mechanical selling, not new information, and it routinely overshoots. And that overshoot is often the gift: the panic close that tags a mapped level after hours is where the next morning’s reload sets up.
7. Borrowing to be bullish just got expensive
Financing a month of equity exposure now costs 138bps over the overnight rate. Think of it as the Street’s margin rate, and it just hit a level that says the balance sheet behind all this leverage is full.
Stress shows up in this number before it shows up in price. It’s the same kill-line thinking we already run the book with: one number, checked weekly, that tells us when the regime is bending before the chart admits it.
8. The calm index is hiding a violent market
Stocks are moving independently of each other to a degree not seen in 15 years. That’s not one desk’s math: Goldman’s research shows the same thing in realized terms, with three-month average stock correlation sitting at 0.10, the floor of the past decade. Meanwhile, options on the ten biggest chip names price daily swings more than twice as large as a decade ago. Marvell (MRVL) and Micron (MU) now trade like biotech.
The index is a sedative; the risk and the reward both live in single names. Pick stocks, hedge the index. And remember the calm is rented. When stocks start moving together again, the index inherits all that single-name violence at once.
9. Rallies are making options more expensive
69% of Nasdaq rallies in May drove option prices up instead of down, three times the norm and the most chase-like behavior since 2005.
When a rally makes options pricier, people are chasing with borrowed conviction. Don’t join them at the top of the candle. The machine hands back a better entry within days, and it has all year.
10. The crowd is literally paying for FOMO
In 55% of S&P 500 companies, upside options now cost more than downside protection, the first time in over a decade.
The crowd is overpaying to chase and selling crash protection at a discount to fund it. You don’t have to fade their direction. Take the other side of their pricing instead: buy dips rather than breakouts, and own the cheap tail while they’re giving it away.
Big shift or blip? The innings question
Fair question after ten records in a row: is this a new market, or a phase that mean-reverts the way 2021 did? The honest answer is that it’s three different things stacked on top of each other, and they’re in different innings.
The machine is permanent. Passive crossed the halfway line for good: index funds now hold 52.7% of all US fund assets and 63% of domestic equity fund assets, and the gap widens every month (March alone: $74 billion into index funds, $26 billion out of active). That’s a two-decade ratchet that has never gone backwards. The options structure is the same story: 2025 was the sixth consecutive record year at 15.2 billion contracts, up 26%, and once exchanges list daily expirations and volume migrates to them, it doesn’t migrate back. Retail access is a ratchet too. Commission-free trading, fractional shares, and a brokerage in every pocket don’t get uninvented. And none of it is a US quirk: India quietly became the world’s largest options market on pure retail flow before its regulator stepped in to slow it down. More people, more products, more hours, everywhere. This is the field now. The 2015 market isn’t coming back.
The wave on top of it is cyclical. Retail intensity breathes. The 2021 meme wave faded hard in 2022, when the biggest retail broker lost over a million active users in a year. But look through the waves at the trend: this year’s retail activity is double the 2024 average and 65% above 2025. Higher highs and higher lows. Participation trends up; intensity swings around it. Assume the current frenzy cools at some point. Don’t assume the participants leave.
The bet itself is further along. Concentration this extreme has precedent, none of it recent: Goldman’s research puts today’s top-10 weight at levels unseen since 1932, and each prior concentration peak (1973, 2000, 2009, 2020) eventually saw a selloff of some size. Eventually is the operative word: some took years, and 2020’s peak resolved by going higher first. Meanwhile the engine funding the whole trade is still accelerating, not rolling over. The four big AI platforms plan roughly $725 billion of capex in 2026, up 77% from $410 billion last year, and the bulls’ case is that revenue is keeping pace. Spending cycles don’t usually end while the spend is still accelerating. But every gauge of crowd behavior around the trade sits at a record, and record positioning is a late-innings reading even when the fundamentals are mid-game.
So the clear read: the field is permanent, the earnings cycle is mid-game, the positioning is late. Structure doesn’t mean-revert. Positioning always does. Trade the structure, respect the positioning, and let the four switches below decide which one is talking.
The second level: everyone read the same report
One more layer, because it matters: this data is public. Every desk on the Street saw the same 20 charts we did. So the question isn’t just what the data says. It’s what everyone knowing it does to the trade.
A known bid gets front-run. If the whole market knows retail buys 3.5x on red days, fast money stops waiting for the level and buys ahead of it. That’s part of why dips keep getting shallower: the front-runners keep pulling the entry higher. It also makes the eventual failure uglier, because the day retail doesn’t show, the front-runners are trapped long at higher prices with a smaller exit door. Practically: don’t be surprised when zones fill early, and when switch 1 finally fires, expect the move to travel faster than history suggests. Everyone is watching the same tell.
Consider who’s talking. The firm publishing “retail is the structural bid” is the firm that earns its living executing retail flow. That doesn’t make the data wrong; it’s the best flow data in the world. But it tells you what’s not in the report: who’s been selling to retail at these prices. Record buying requires a record seller, and if that seller is institutions quietly handing off inventory, the same chart reads as distribution instead of strength. Recent prime-broker data has shown institutions buying alongside retail rather than into them, which is the healthier read. It’s also the single thing most worth re-checking every month.
Reflexivity cuts both ways. The more the structural-bid story is believed, the faster dips get bought, the shallower pullbacks get, and the more the story is believed. Loops like this run further than anyone expects and then break all at once. A report this good accelerates its own thesis in the short run and hollows it out underneath. The tell that the loop is aging isn’t price, it’s entry quality: when the tape stops offering even first touches, the spring is fully compressed.
And the pain trade might be up, not down. Whoever sold the record call chase is short upside into strength, and active managers trailing the index for another year get forced to chase leaders into year-end, with diversification rules capping how much of the winners many of them can even hold. In a market where everyone is bracing for the crash, the melt-up is the underpriced branch. Which is why we express upside in the underlying at pullbacks, where the crowd isn’t, and keep the puts for the branch they’re giving away.
Three wildcards for the second half
The calm is on borrowed time, statistically. 2026 is a midterm election year, and midterm years are historically the loud ones: 46 daily moves of 2% or more in 2022, 20 in 2018. Through June, 2026 has printed exactly four. Either this year becomes a historic outlier, or the back half has catching up to do. That’s not a prediction, it’s base rates, and it’s another reason the cheap protection keeps getting bought here.
The Fed is removing its own shock absorber. The new chair has openly questioned the value of forward guidance, the tool that telegraphed every policy turn for two decades, while holding the line that the 2% inflation target isn’t open to debate. Less telegraphing means more data-day surprises, in a market that already resolves through gaps instead of warnings. Event days deserve more respect in H2, not less.
The tail nobody prices daily. With chips at 19.7% of the index, Taiwan is the single largest concentrated risk in world markets, and Citadel’s own founder called losing access to TSMC’s chips catastrophic for the global economy just last month. Nobody can trade around that headline after it prints. That’s exactly the kind of tail the inverted skew in #10 lets us own for almost nothing.
The playbook, in one breath
Long via pullbacks at mapped levels, never breakout candles. First test is the entry. Scale partials, always keep a runner, because in this tape entries are easy and exits are the alpha. Leaders only; laggards are value traps when stocks move this independently. Protection stays on as an actual ticketed trade while it’s this cheap. And when nothing lines up, flat is a position.
One more risk rule, borrowed from the founder of the firm whose data built this note: you can’t hedge every tail, so define the loss you can tolerate and structure the book to survive the worst case. That’s what the ticketed hedge is. Not a prediction. A survival constraint.
The four switches that end the party
Every regime dies from something specific. This one has four candidates, all measurable.
Switch 1: the dip-buyer doesn’t show. If retail’s down-day buying collapses and first touches stop bouncing, the market just lost its only marginal buyer. Dip size gets cut in half and only the deep zones are entries.
Switch 2: funding keeps tightening. If financing spreads push past 138bps to new highs while leveraged ETF assets shrink, the most aggressive money has flipped from buying dips to selling them. Breakouts come off the menu and rallies become supply.
Switch 3: the chip engine breaks. If semis gap down and can’t reclaim, and especially if the leaders break while the index holds, cut theme exposure before touching index posture. Rotation to other sectors is survivable. Money leaving isn’t.
Switch 4: the correlation snap. If everything starts moving together and daily ranges double without worse news, single-name edge is dead and index hedges become the core position, not the afterthought.
Expected order: funding and chip stress crack first, the dip-buyer quits after getting burned, and the correlation snap is the finale, not the warning. The first two get checked every week precisely so the last one never gets to surprise us.
Where this leaves us
You don’t have to predict this market. You have to know what it is: a machine that buys dips on schedule, crowds into leaders, rebalances into every close, and resets its bets nightly. Trade with it. Buy the mapped level, ride the leader, keep the cheap hedge, and watch four numbers while everyone else watches headlines. The people who get hurt in the second half will be the ones still trading a market that no longer exists.
Primary source: Citadel Securities Global Market Intelligence, “1H 2026 Market Structure & Flows,” June 30, 2026. All 20 exhibits reviewed. Supporting data from ICI, Cboe, Goldman Sachs research, Morningstar, and published company guidance, attributed where cited.
Where/how can you track financing cost that you mentioned is now 138bps?