

Most market commentary can’t be wrong. It says stocks “could see continued volatility,” which has been true every day in history, and nobody comes back to check.
We publish two things, and both can be proven wrong by Friday.
The Lie is a score. How confident are we this week, and how much should be at risk?
The levels are five to seven prices, written down before the week starts. Each has a job. Price down to 7,400 is where we buy. A close below 7,374 and we’re out.
The following Sunday we go back and mark both, including the weeks they went against us. This post is that record from the first week we kept it.
If you don’t trade: this is about ES, the futures contract that tracks the S&P 500. It’s how professionals trade the index itself. When you see 7,722.00, that’s the S&P quoted the way a trading desk sees it.
The market it happened in
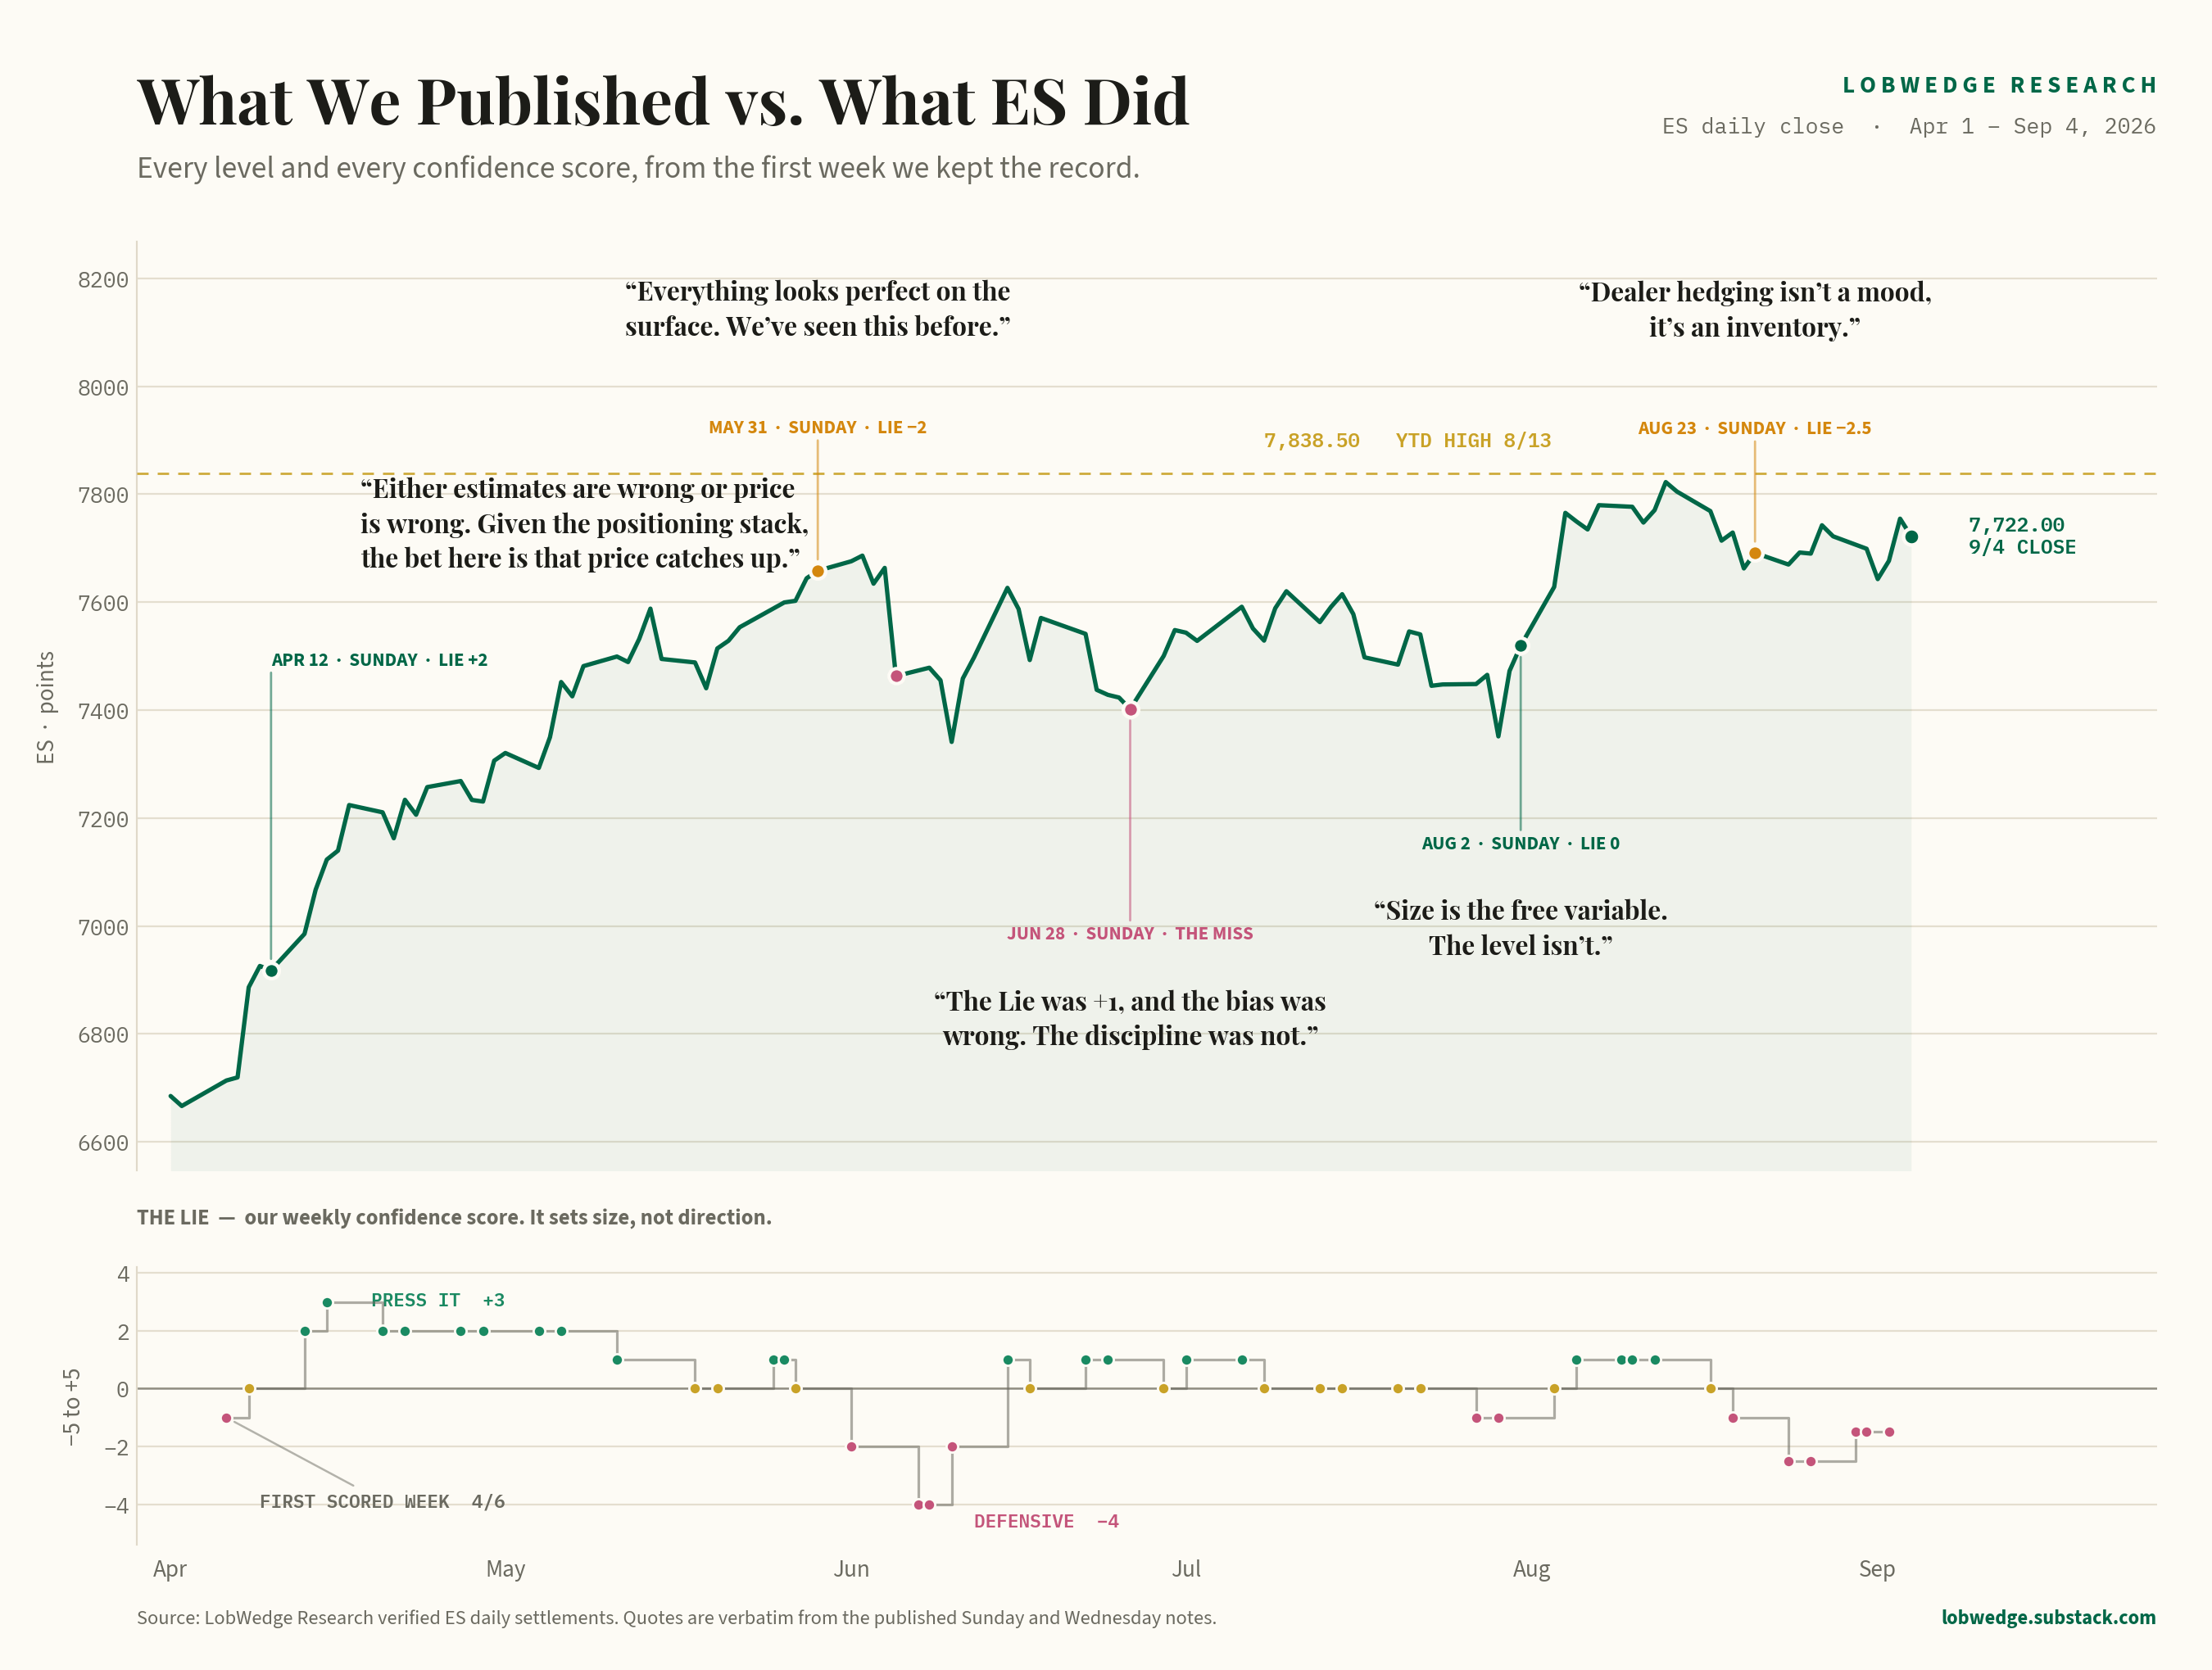
ES started April at 6,681.00 and settled at 7,722.00 on September 4. Up 15.58%.
That sounds like a year-long climb. It wasn’t.
April alone did +9.36% of it, and since July 1 the index has managed 2.37% in nine weeks while up days ran 59 out of 108, which is the kind of split you’d get flipping a coin with a very slight thumb on it. The range tells the story better than the return anyway. A typical week this year covered about 170 points high to low, and the last four averaged 136. The market’s swinging inside a box and the box keeps shrinking.
Ranges like that punish guessing. So the prices go out before the week does.
The Lie
Five separate checks on what’s happening underneath the index, combined into one number. The scale runs −5 to +5. It’s never printed outside −4 to +3.
One rule makes it useful: the score sets how much, not which way.
A −2 doesn’t mean bet on a decline. It means bet less. Direction comes from the levels. Most confidence indicators get this backwards, turn into a permanent bear call, and are eventually right once after being wrong for two years.
Forty-six scores since April 6. Every one published before the week traded.
Why five checks
One indicator always tells a clean story. The disagreements are where the work is, and they’re most weeks.
May 3, with the market rallying:
“Selling exhaustion confirmed. Institutional positioning improving. But breadth scored zero. Until the average stock starts pulling its weight, rallies into prior highs will get faded.”
Most of the checks were fine.
One wasn’t. The recovery was real and the big money was buying, but the number of companies actually participating had gone flat. That doesn’t say sell. It says the rally’s thinner than the headline, so pushes into old highs should fail. They did.
When it worked
May 31, after the score dropped three points in a week:
“Everything looks perfect on the surface. We’ve seen this before.”
Five days later ES fell 200 points in a session, the worst day of the year. The score moved before price did.
When it didn’t
July 12. This is the expensive kind, because the mistake was in how we did it:
“The miss was the score itself: we held a constructive call on judgment while the model said neutral, and the bond market took it back within three days. The model was right.”
The math said neutral. We felt better than neutral and published the better number. Three days later the market sided with the math.
That week, overriding the score by feel stopped being allowed. The published score is whatever the model says, and it moves only on a written condition. That’s what a miss is supposed to buy you.
It’s early and we’d rather say so
Forty-six readings isn’t much. The Lie is a young model we’re adapting against live data, and you should hear that from us.
We test it as the record grows. When a piece of it doesn’t hold up we change what we claim instead of quietly continuing to claim it. That’s already happened once, and it’s why the score is described as a size dial.
The sample is small and all of it comes from a rising market. None of this has met a bad year yet.
What’s below is real and unedited. It’s also five months old. Ask us again after a bad year.
Everything feeds it
The score is one output. The work behind it is wider, because drawing a price takes more than a sentiment reading.
Bonds and credit, where trouble shows up first. Breadth, to see how many companies are carrying the index. Earnings, read for the reaction more than the number. Where the big institutions are positioned. Options positioning, useful for one narrow thing: knowing when the market’s being pinned inside a range by hedging flows that have nothing to do with what anybody thinks. Chart structure. Central bank liquidity. The economic calendar. Policy risk.
“The bond market already answered ... Credit spreads still tight but rates are screaming something equities haven’t heard yet. PTJ’s first rule: when bonds and stocks disagree, listen to the bonds.”
Nothing in there gets to override the rest on its own. Every piece produces a written brief, the briefs feed the engines behind the score and the prices, and automated checks run before any of it publishes. That loop hasn’t skipped a week since April.
The levels
Five to seven prices a week, written down Sunday before anything happens.
The grading rule matters more than the hit rate. A level only counts if the market actually reaches it. Publish a buy price the market never falls to and you haven’t been right about anything. Plenty of forecasters quietly bank the ones that never traded.
33 of 38 published levels behaved as drawn across the weeks graded line by line.
When they worked
April 12. Companies were raising earnings forecasts and the market wasn’t going up.
“Either estimates are wrong or price is wrong. Given the positioning stack, the bet here is that price catches up.”
Both couldn’t be true. Either those companies were about to disappoint or the market was too cheap, and we took the second. The buy price went out at 6,792 to 6,814. Monday opened at 6,784. By April 30 it was 7,306.
The following week’s note covered the part that decides whether you survive, which is where you admit you’re wrong:
“Size is the free variable. The level isn’t.”
Put the exit where a break actually means something. If that makes the risk too big, buy less. Never slide the stop closer because the number looks better that way. More accounts die from moved stops than from bad entries.
When they didn’t
August 9. The market opened Monday far above Friday’s close and never came back.
“The miss is worth more than the hits. The framework’s own fine print says downside odds struck off Friday’s close die in a gap, and Monday’s gap killed them all.”
Every buy price sat below the market and the market jumped all of them overnight. Nothing about the read was wrong. It just never got a chance to be right, and a reader is out the same either way. Redrawing after a gap like that is an automatic step now.
June 28 was the worst week on this measure. Of the four prices the market actually reached, three failed. We led that Sunday’s note with it.
The asterisk
A record like 33 of 38 deserves the conditions it was earned in.
Of these 108 trading days, twenty-one moved more than 1%. Two moved more than 2%. That’s a calm market by any historical standard, and calm markets flatter this kind of work. Ranges hold. A score has room to be roughly right without getting punished for it.
The one time it wasn’t calm the framework was already leaning back, with the score at −2 on May 31 and the market down 200 points on June 5. That’s one week.
The open question is how any of it behaves when the swings last a month instead of an afternoon, and we won’t know until it happens. When it does, the record gets harder. It also gets graded on the same schedule, in the same place, with the same willingness to print the bad weeks.
Why it’s graded this carefully
Trading infrastructure is nearly free now. Anyone can get data and place an order.
Knowing how much to risk still isn’t, and every serious way of sizing a position ends up needing the same input you can’t buy from anybody: your own accuracy, measured on your own calls, using the exits you actually took rather than the ones you’d describe afterward.
You can’t compute that from a track record nobody wrote down.
So the graded record is the thing we’re building. The letter is where it gets published.
What you get
A plan every Sunday, an update every Wednesday. The score, the prices, a written line for what would prove us wrong, and the scorecard the week after, whichever way it went.
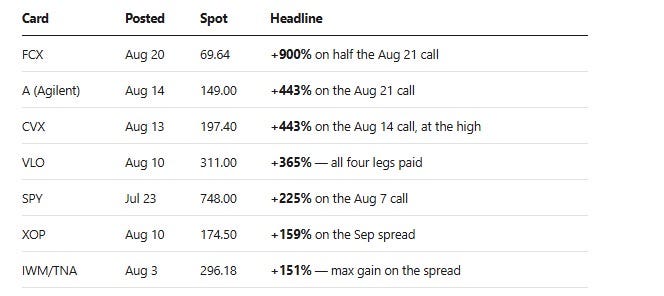
Also note, our recent experiement with options cards.. not so bad either.
Nothing here is investment advice. Futures and options carry substantial risk of loss.