

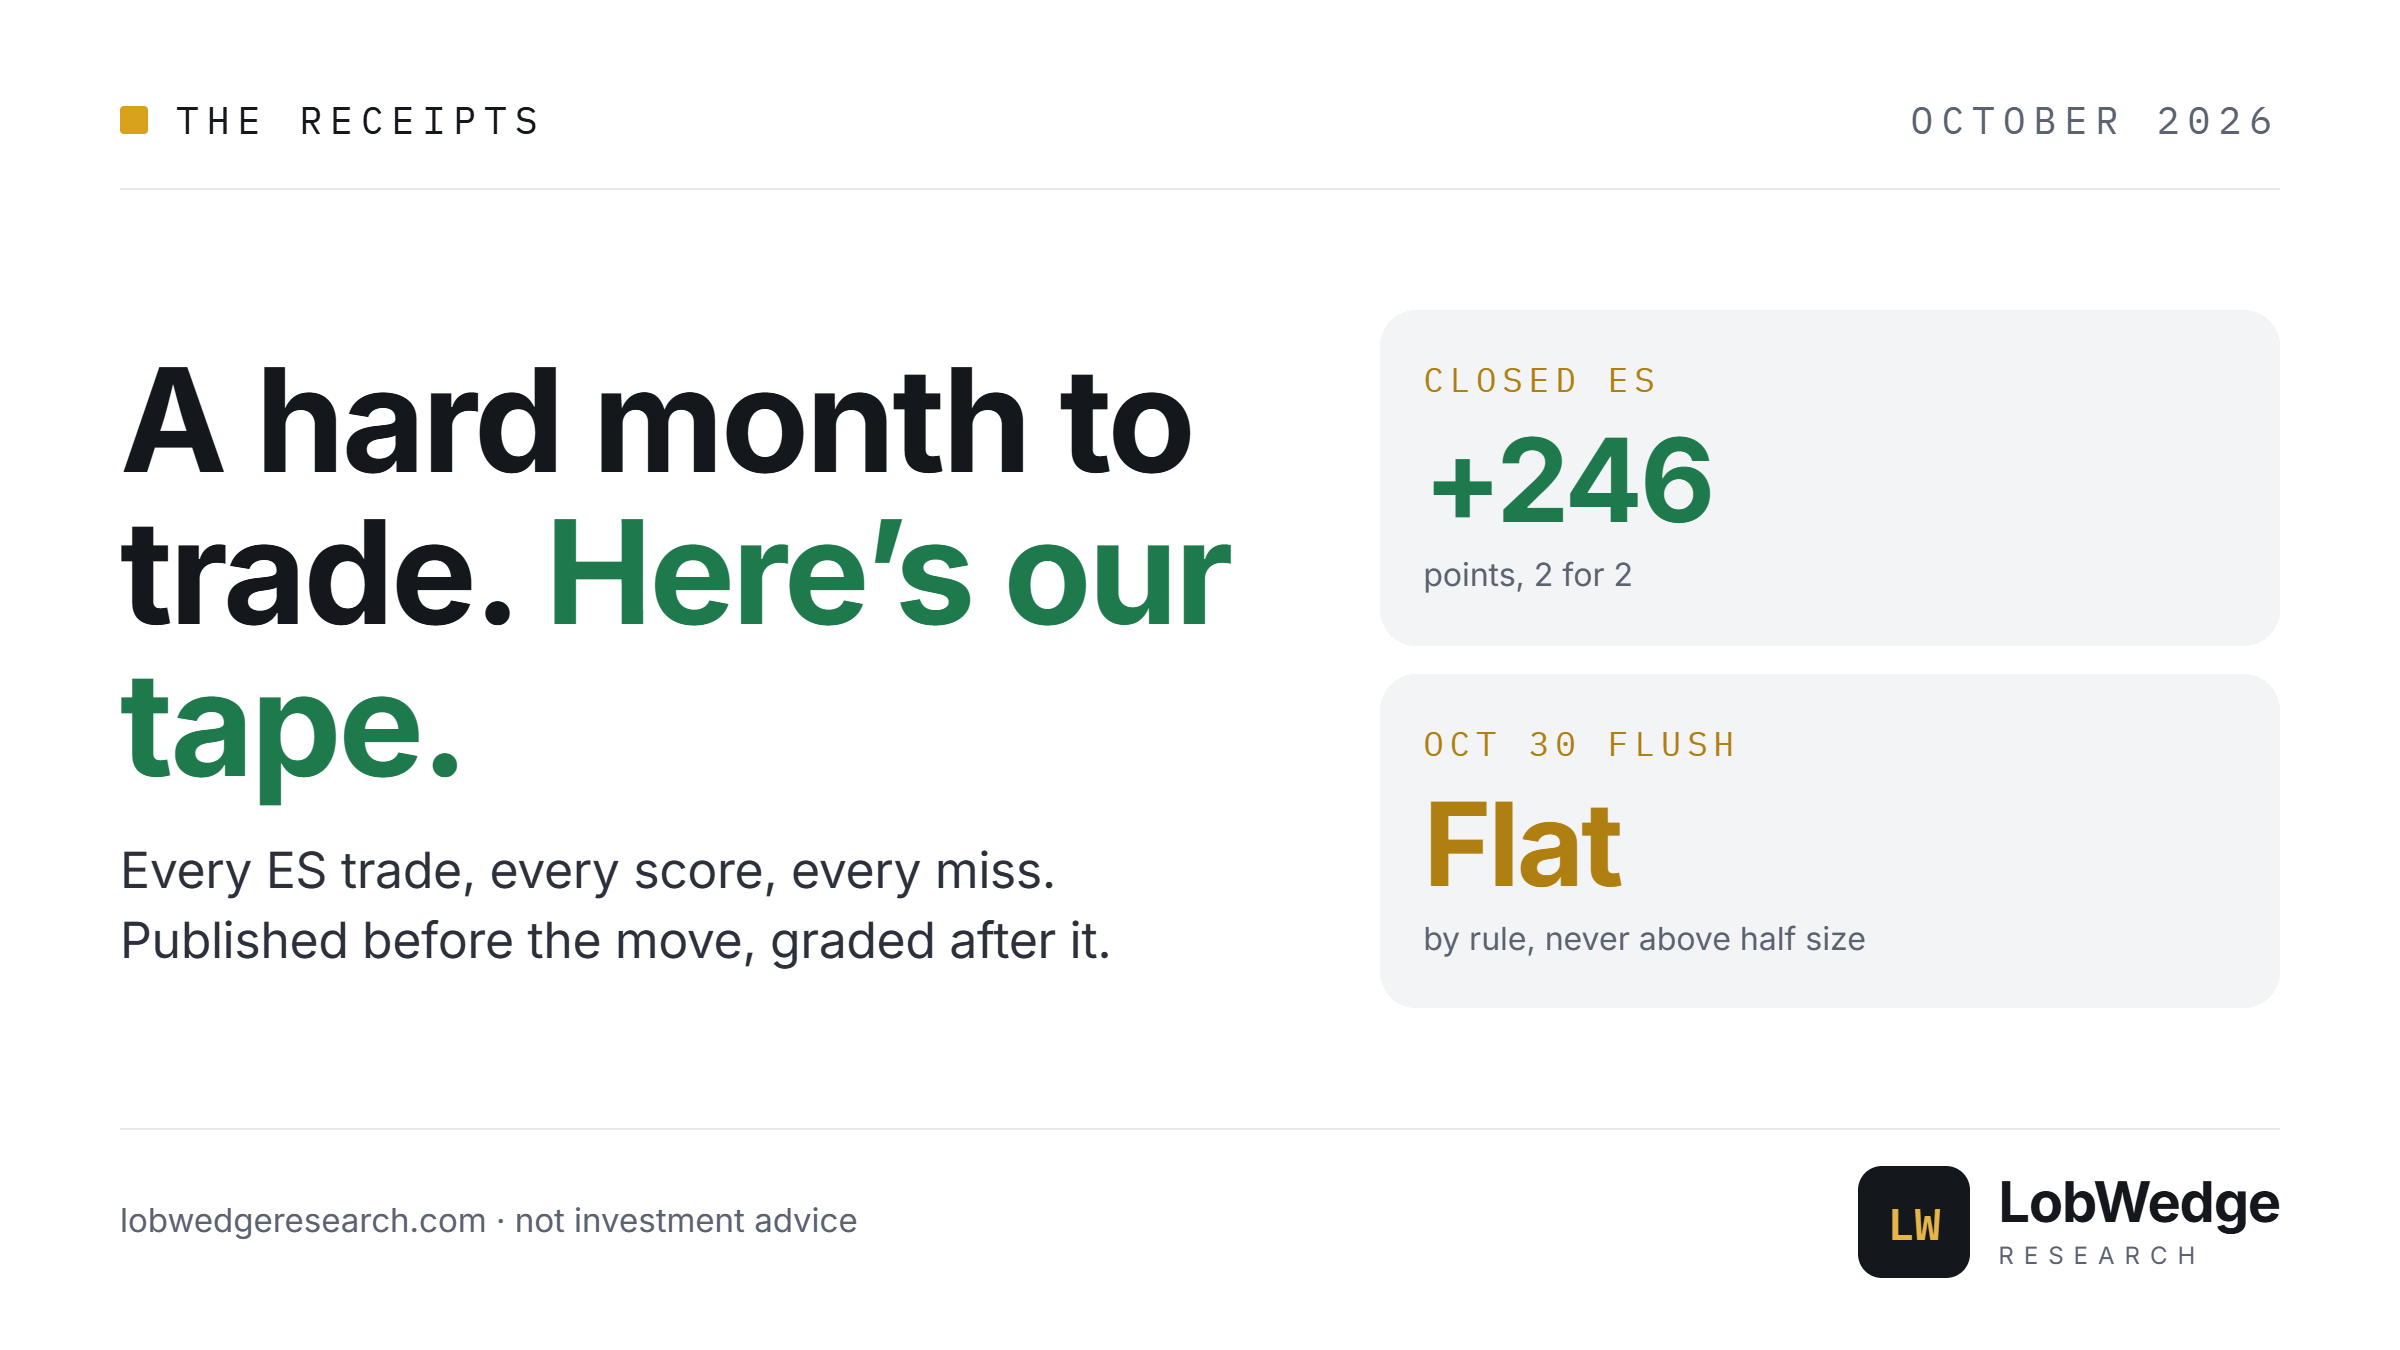
ES made a record on October 6 and was 340 pts lower by October 30. Hot CPI, a reversal on the 22nd and a chip-led flush on the 30th did most of the damage.
We publish the ES map every Sunday and Wednesday: where to buy, where to take profit, and the one close that says we're wrong. Here's how it held up. Every number below was published before the move.
The result
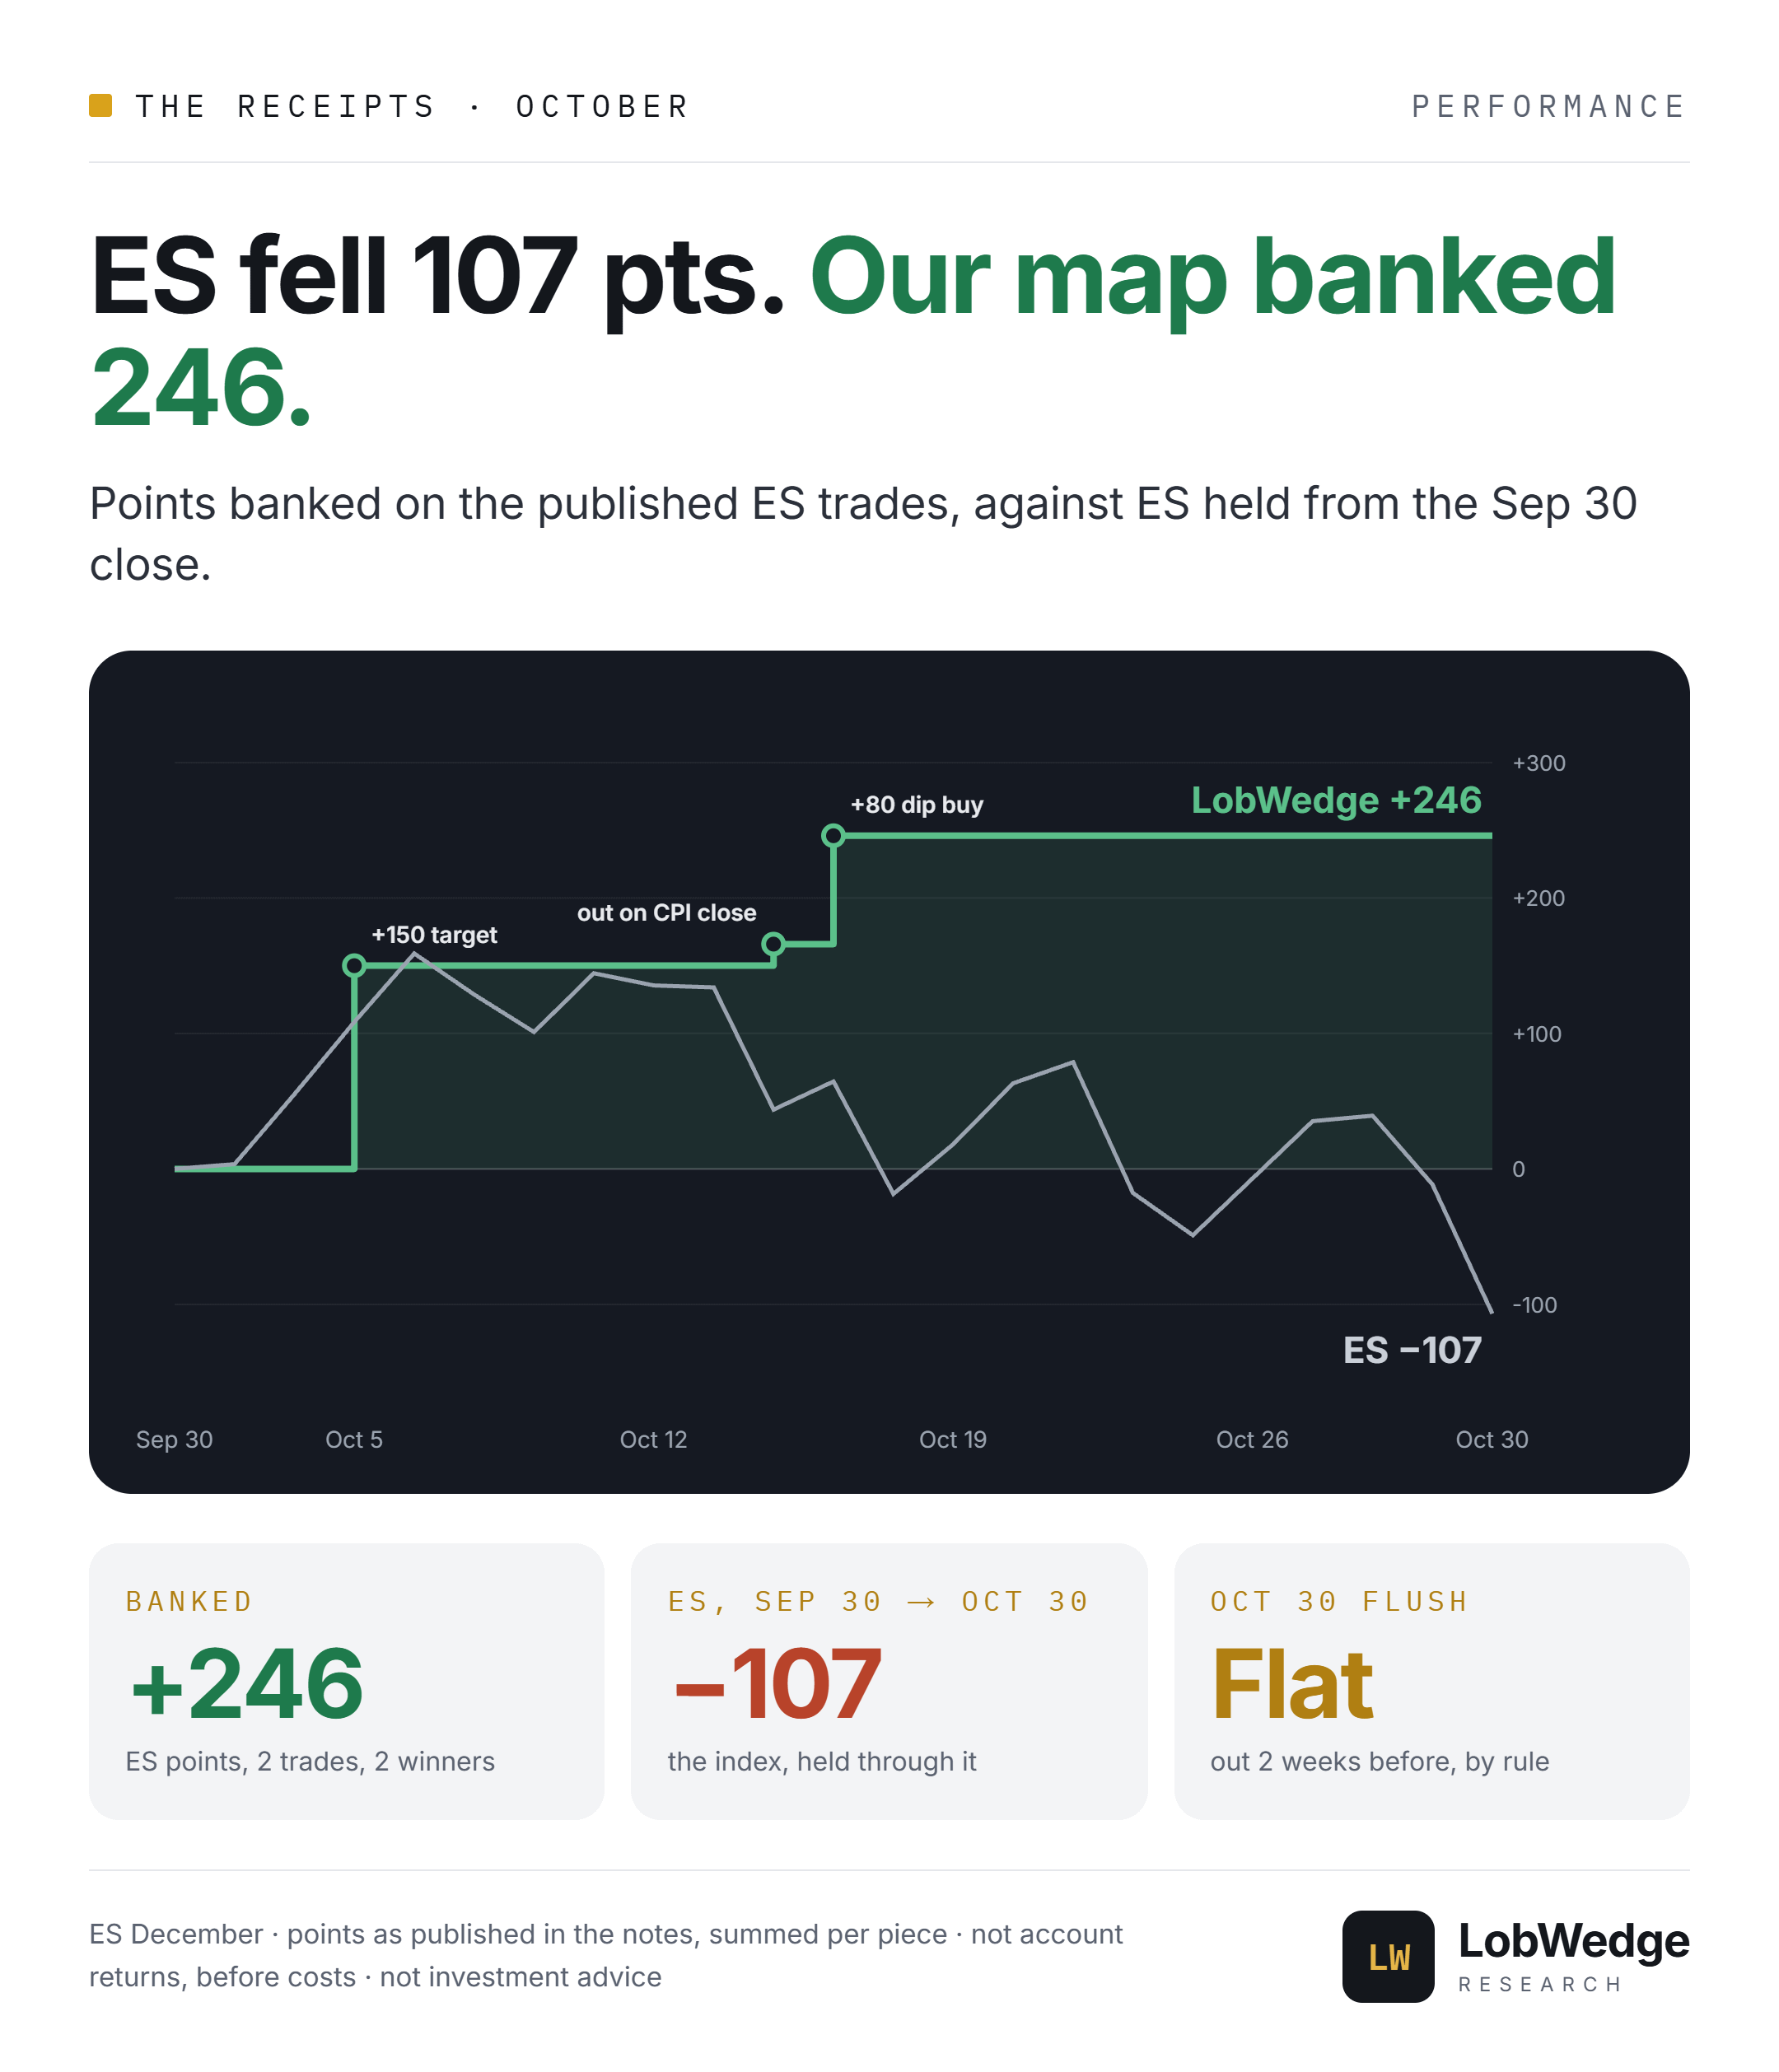
ES lost 107 pts from September 30 to October 30. The map closed 2 trades, both winners, for 246 pts, and never used more than half size.
Bought the flush at 7,687 on Oct 1. Took half off at the 7,837 target for +150. The rest came out on the CPI close, by the rule we'd printed: +166 on the trade.
Bought the dip at 7,720 on Oct 15. Sold at 7,800 the same day: +80.
Flat from Oct 19 to 30. The pivot never held, so the rule said no fill. We were out for the October 30 flush.
The drawdown we skipped
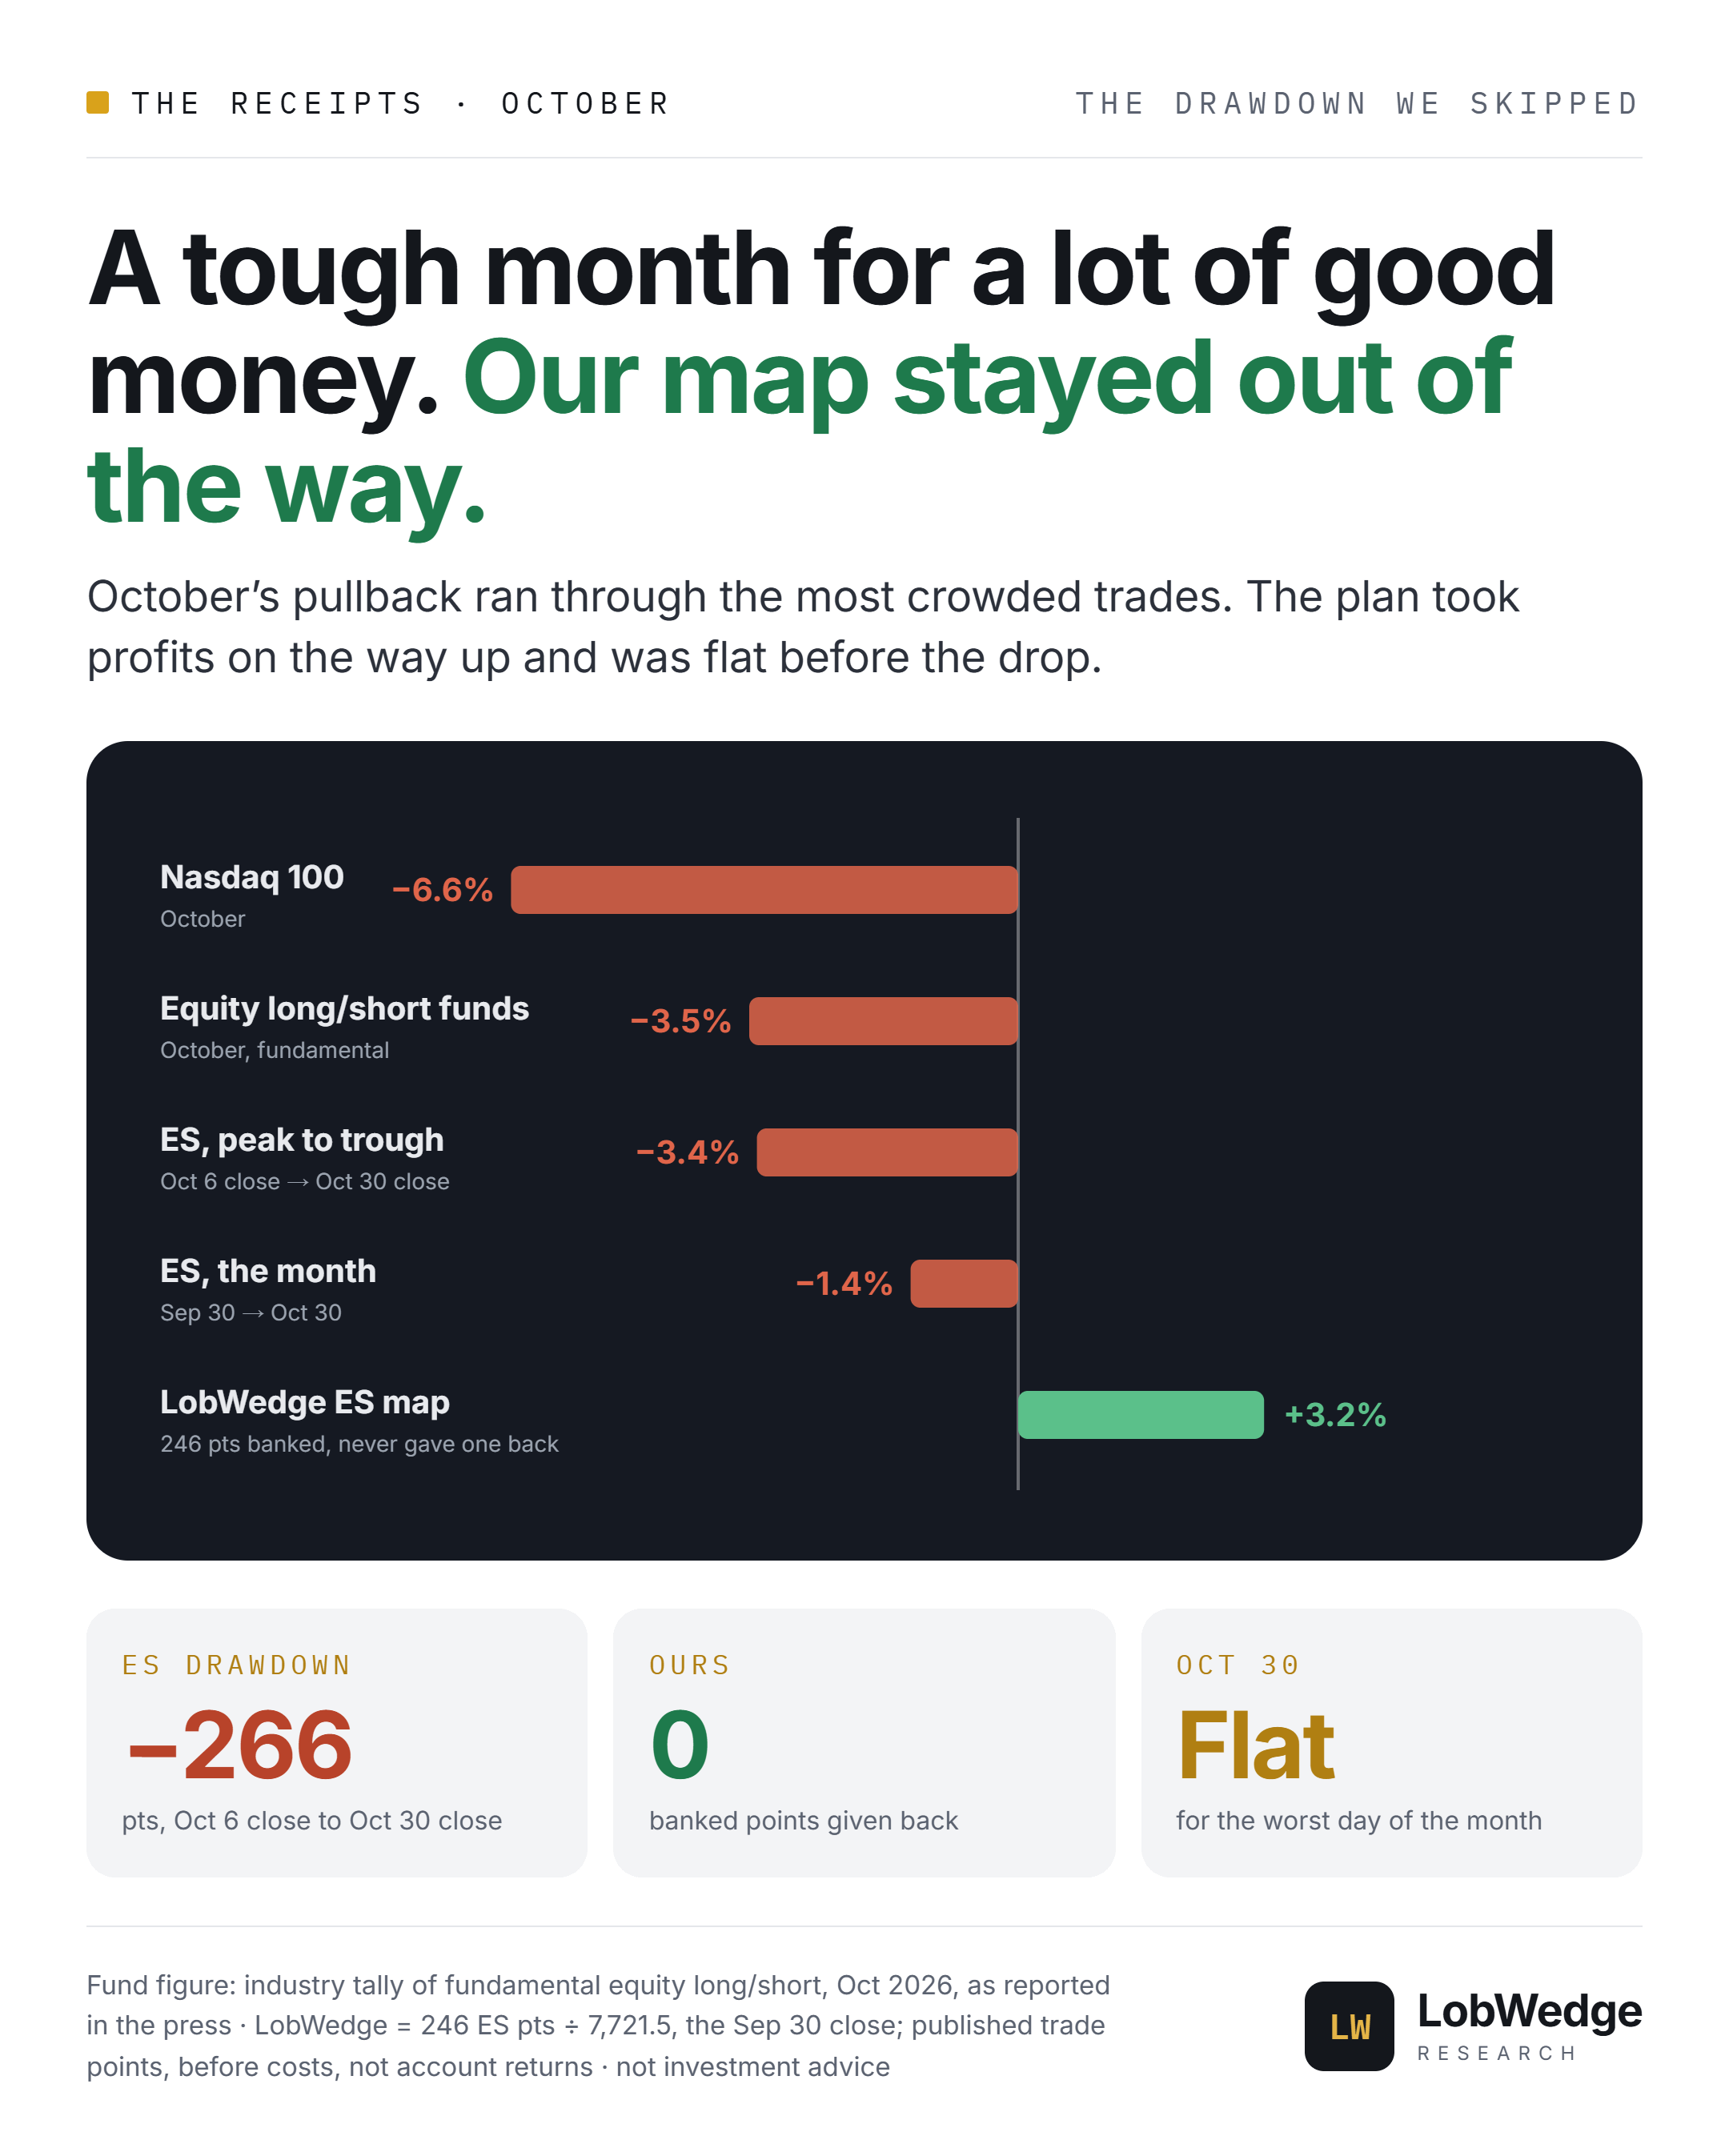
October was hard on a lot of experienced investors. The selling went through the most crowded corner of the market, AI and big tech. The Nasdaq 100 fell 6.6% on the month. Industry tallies showed equity long/short funds down about 3.5%, and both the fundamental and systematic styles lost more than 3% in the same month for the first time since 2016. None of that says anything about anyone's skill. Months like this happen, and the people who live through them are the ones who keep their size under control.
Here's where our map was. ES fell 266 pts from the October 6 close to the October 30 close. We'd taken half our position off at the 7,837 target on the way up, the CPI close took the rest out on October 14, and from October 19 on the rule kept us flat. We didn't give back a single banked point. On the month's worst day we had no position.
None of that took a market call. It took 3 rules we'd written down ahead of time: take profit at the target, exit on the close, and don't buy a level price is slicing through.
Our levels at work
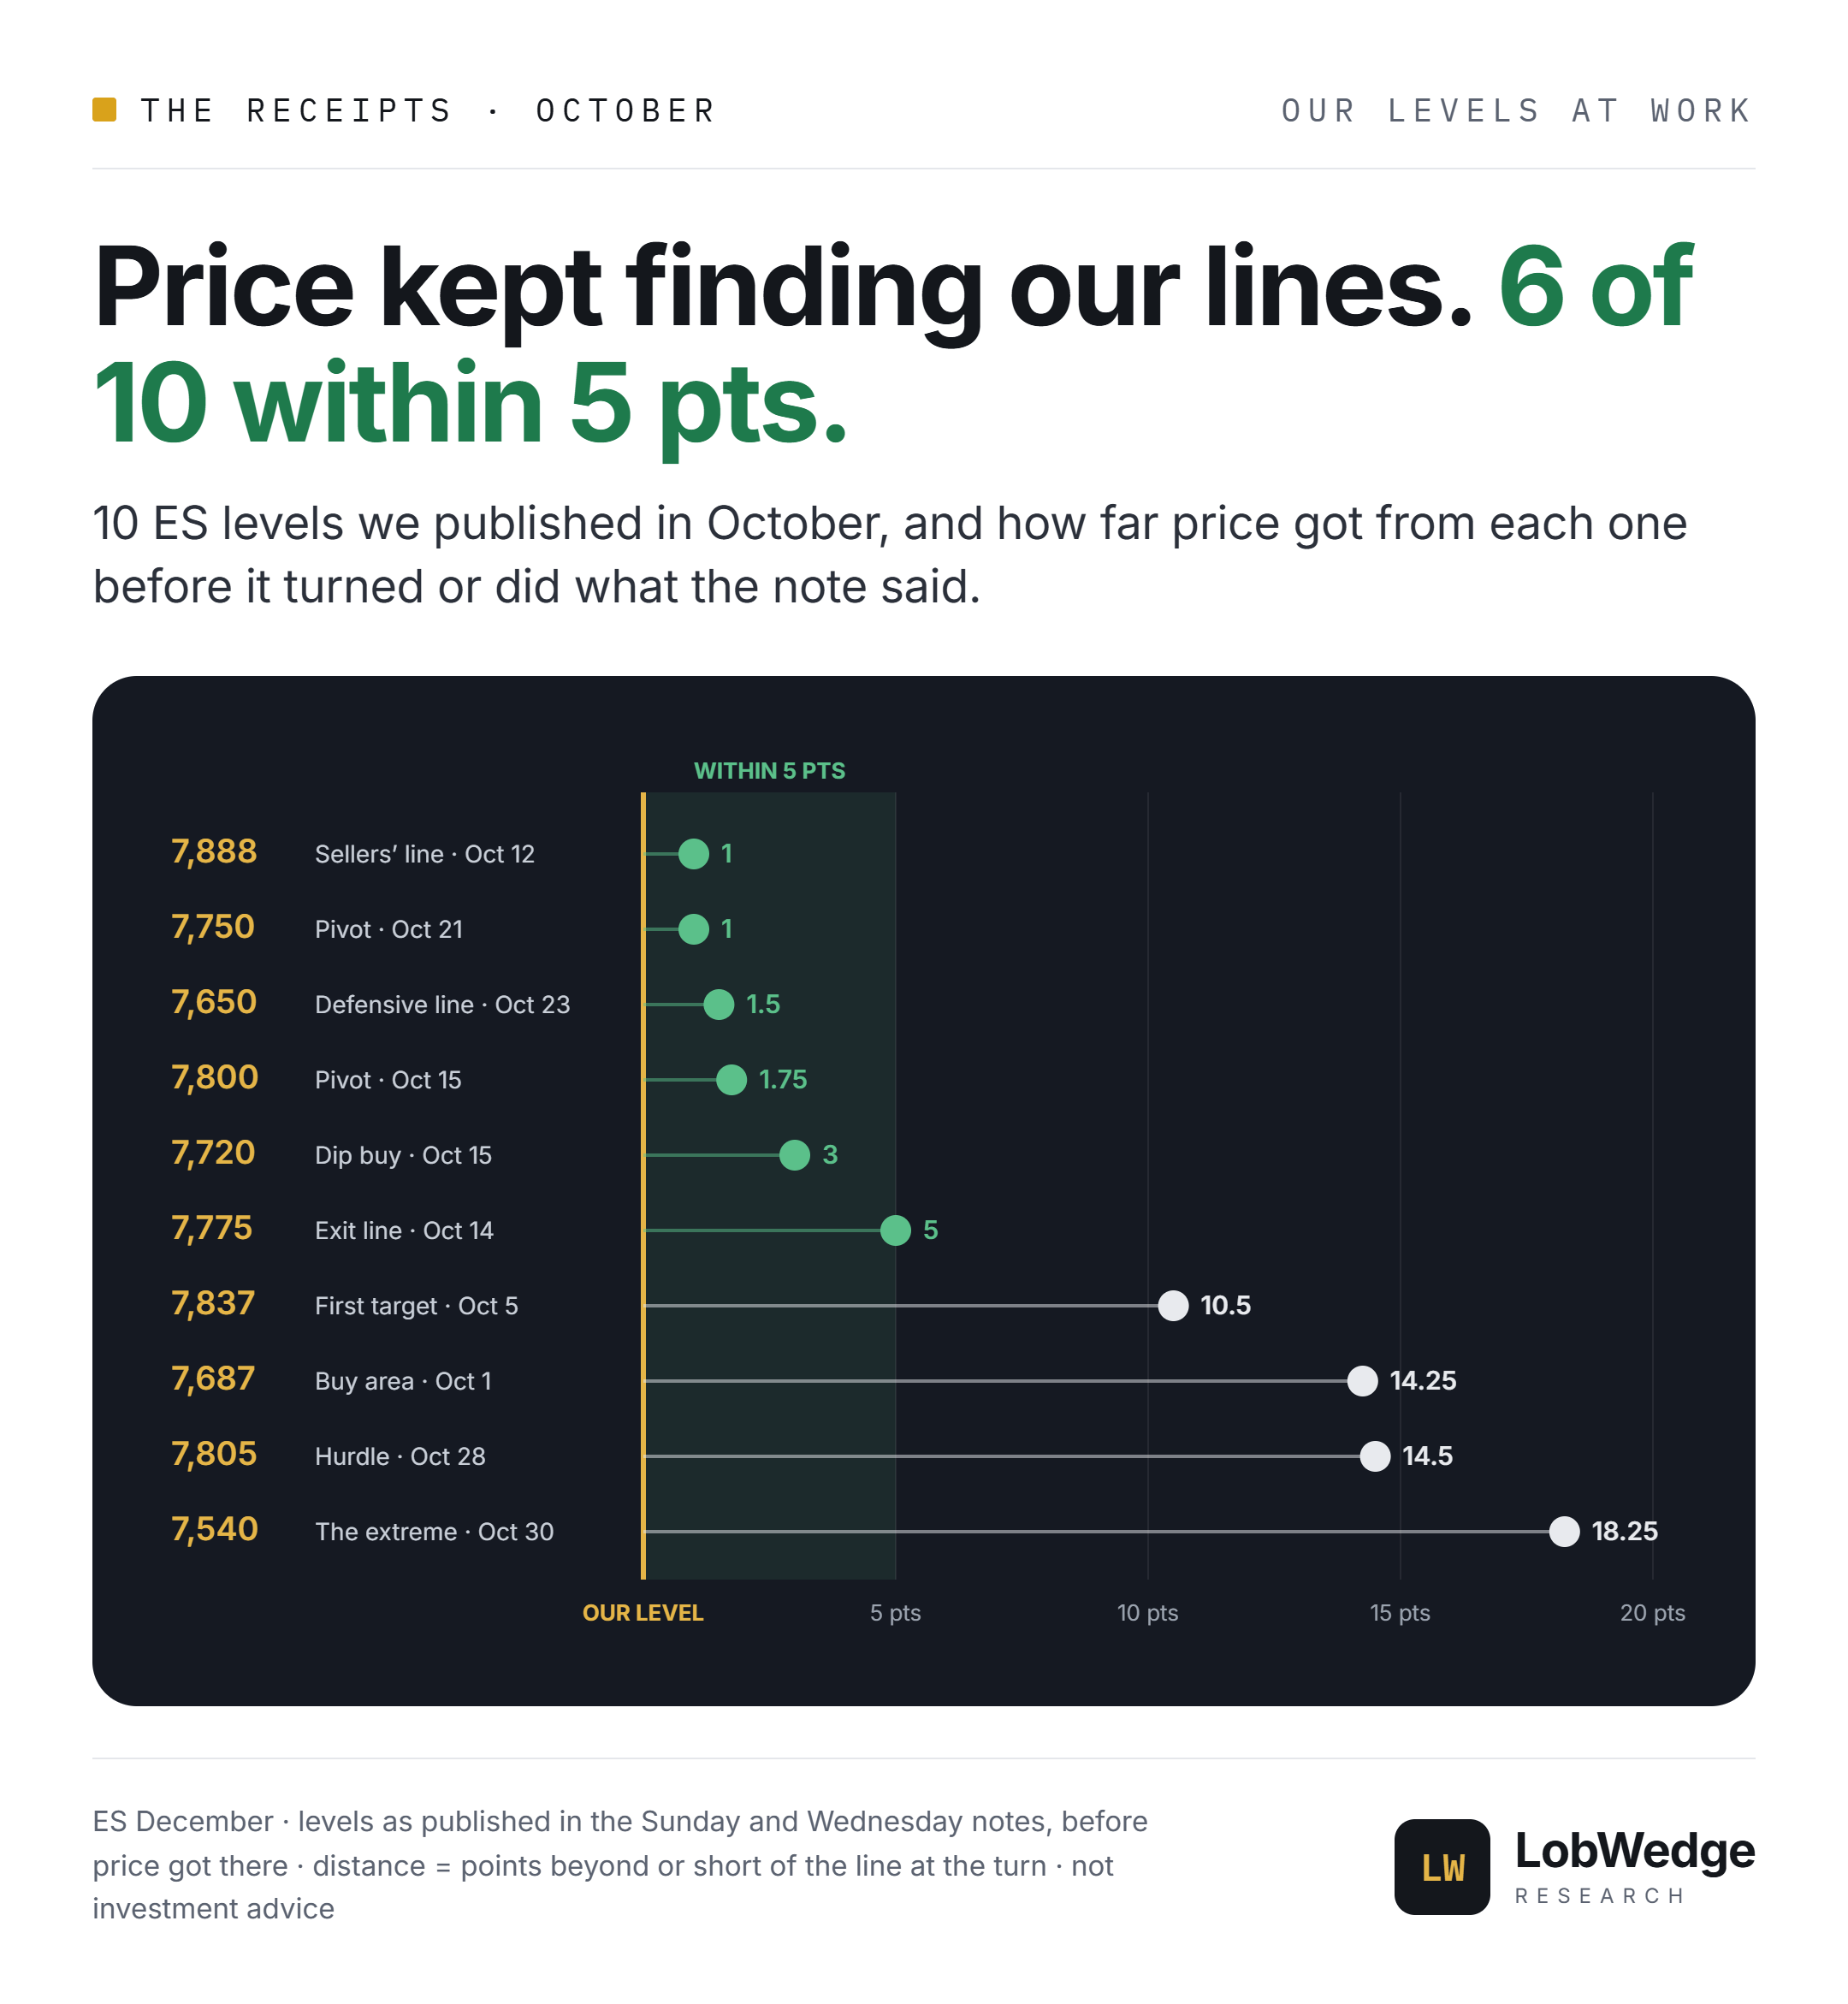
These are 10 lines from October's notes and how close ES came to each one. 6 of them were within 5 pts. The defensive line at 7,650 held by 1.5 pts. The sellers' line at 7,888 missed by 1. The extreme at 7,540 was 18 pts from the October 30 low.
That's what you're paying for: knowing where buyers and sellers are likely to show up before price gets there.
The score kept us small
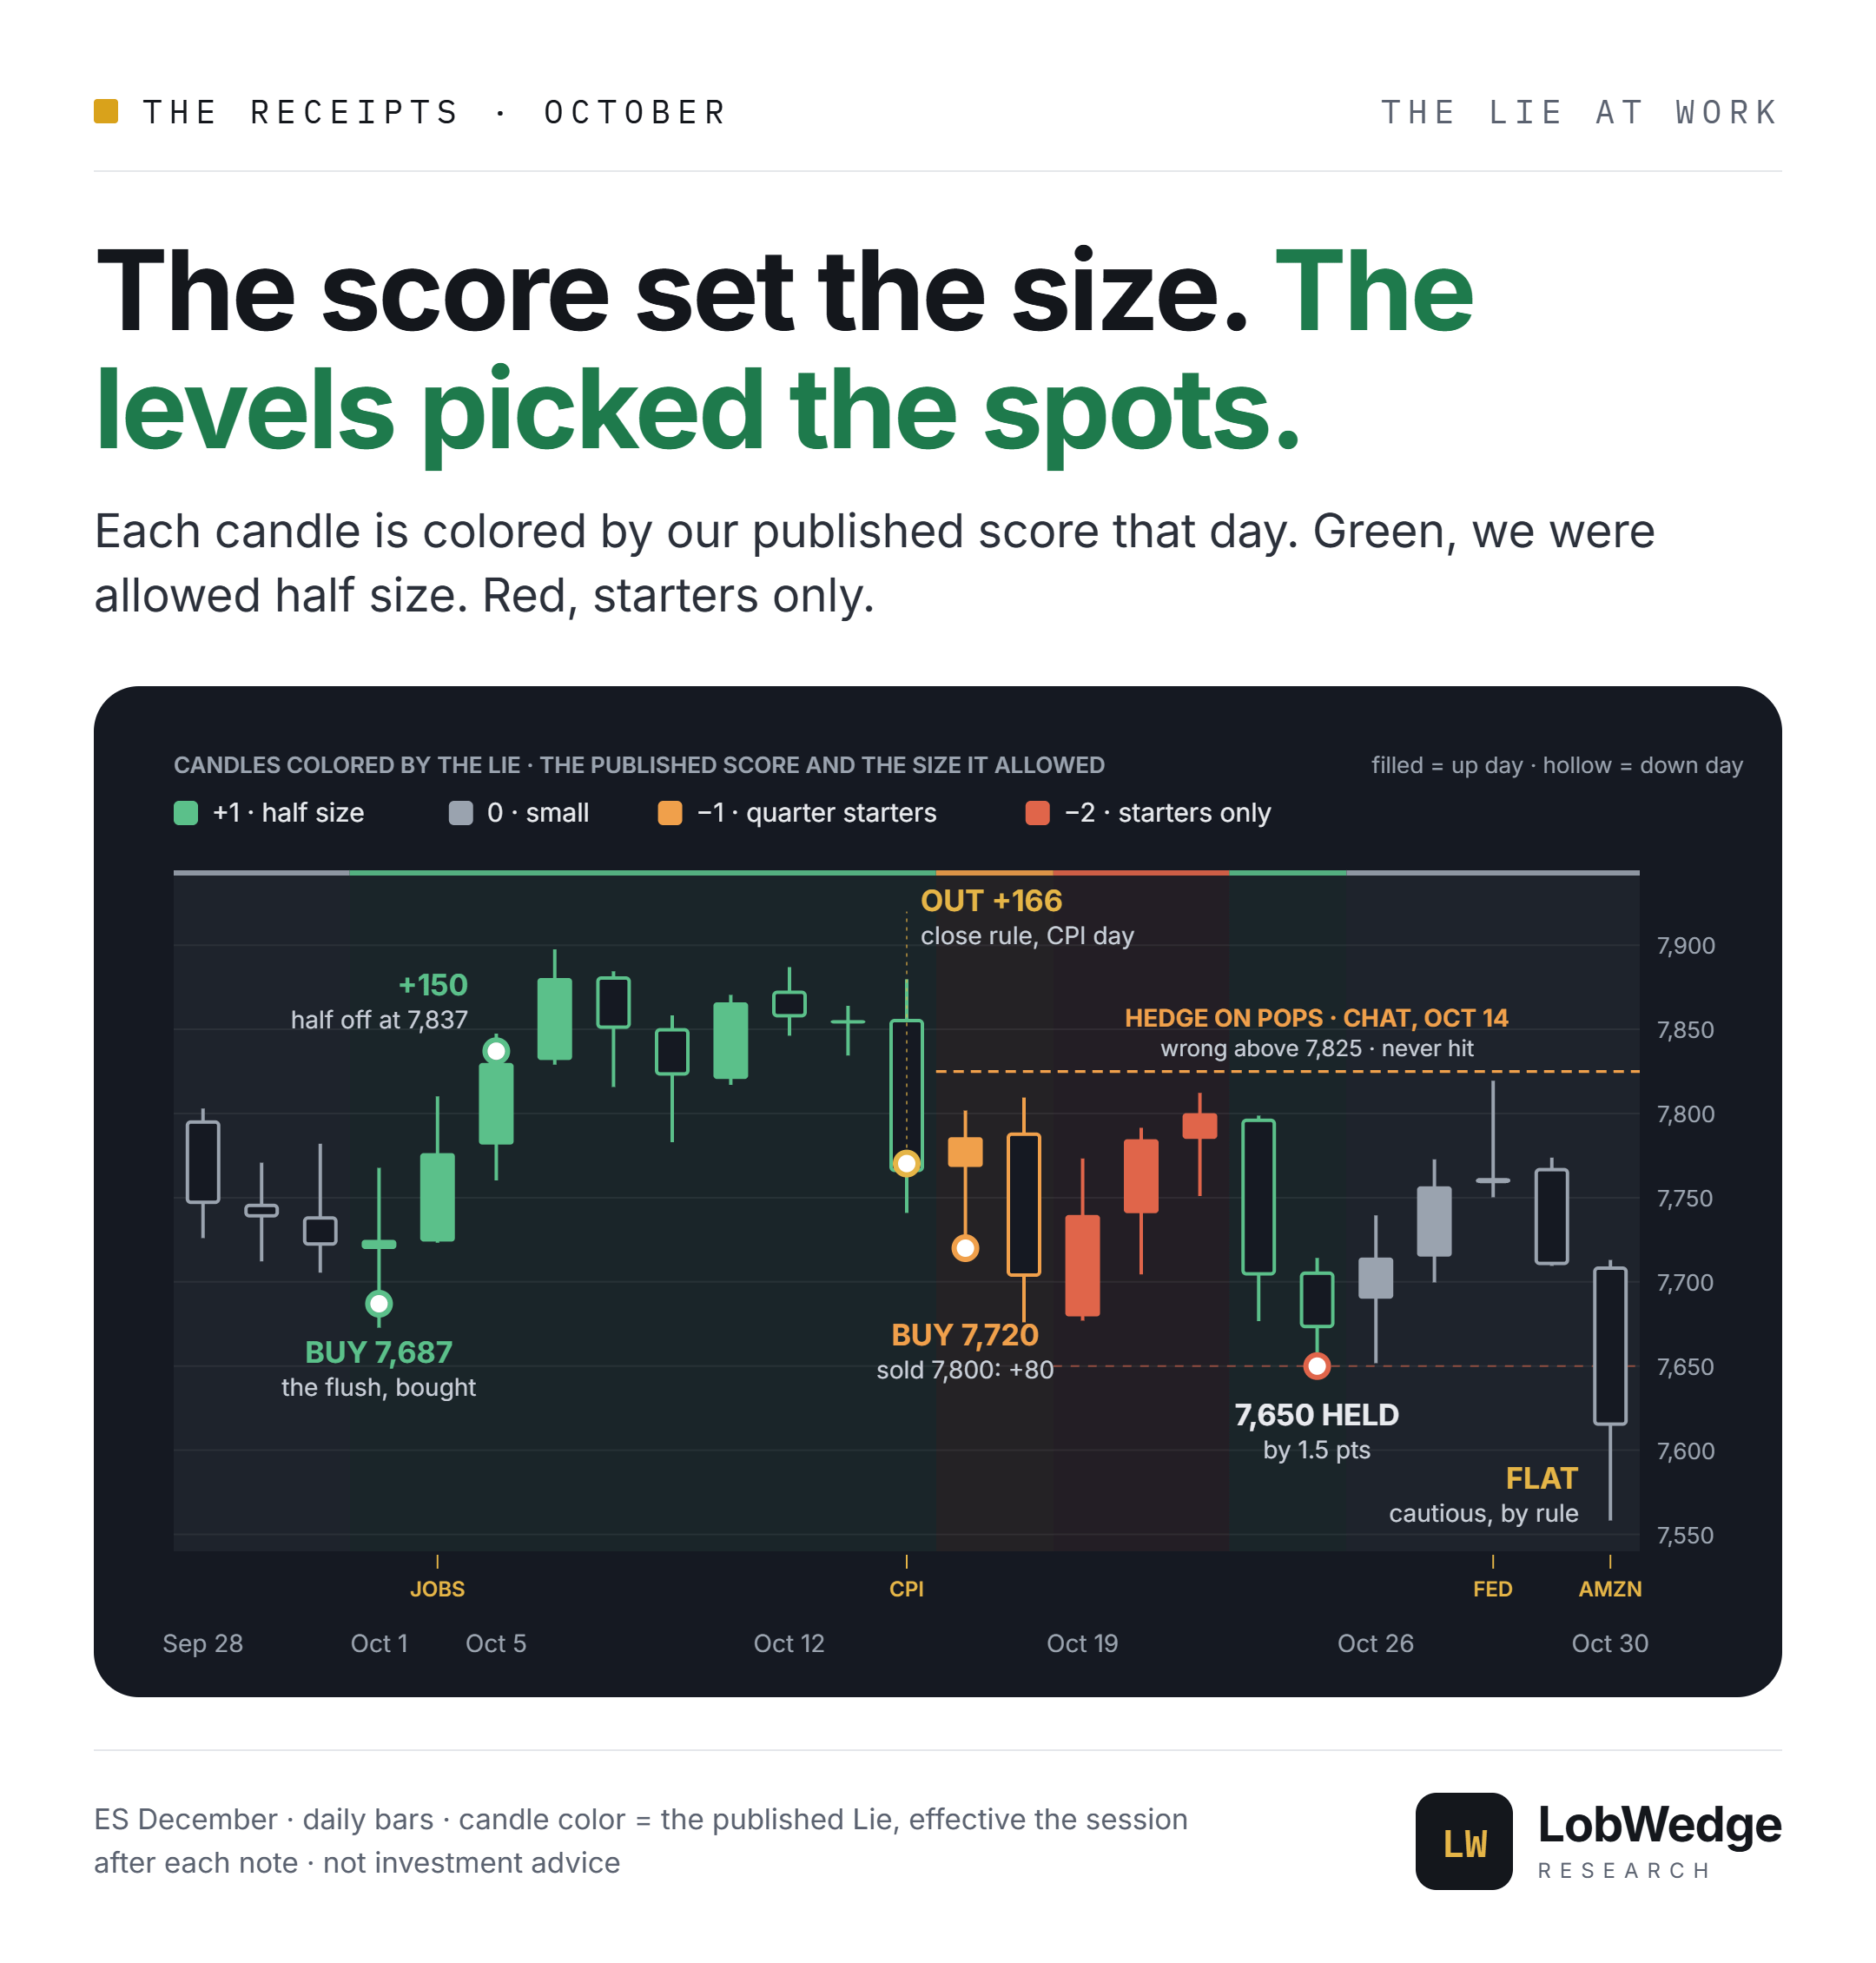
The Lie is our score of the tape, from −5 to +5. It doesn't tell us which way the market goes. It tells us how big to be. Each candle in the chart is colored by the score we published that day.
Green (+1): half size. That was the most the score allowed all month.
Amber and red (−1, −2): starters only. The one starter that filled made 80.
Gray (0): small and two-sided, which is where it sat going into the flush.
Since the score never asked for more than half size, one bad day could never cost a month.
Cautious into the flush
On October 28, the Fed rally pushed through 7,805 and gave it back within the hour. That night's note said to stay flat and cautious until 7,805 held. It also said what came next if things broke: lose 7,695 with volatility rising and 7,540 is in play, so wait.
On Friday ES lost 7,695 after Amazon (AMZN) reported, VIX climbed, and the low printed at 7,558.25, 18 pts above the line we'd named. ES bounced 56 into the close. We weren't long, and we didn't short the low.
Hedges and shorts
Chat, Oct 14: "hedge idea on pops… above 7825 is wrong." The pops stalled at 7,809.50 and ES fell to 7,676. It never traded over 7,825 the rest of the month.
The short we didn't take, Oct 16. 7,800 rejected twice. We sold our long there but didn't flip short, and ES fell 124. The note said so the next Sunday. A pivot that rejects twice is a short.
The breakdown hedge, Oct 28. A defined-risk put spread, published ahead of time for one case only: a close under 7,695 with volatility rising. Friday gave us exactly that close.
Scorecard
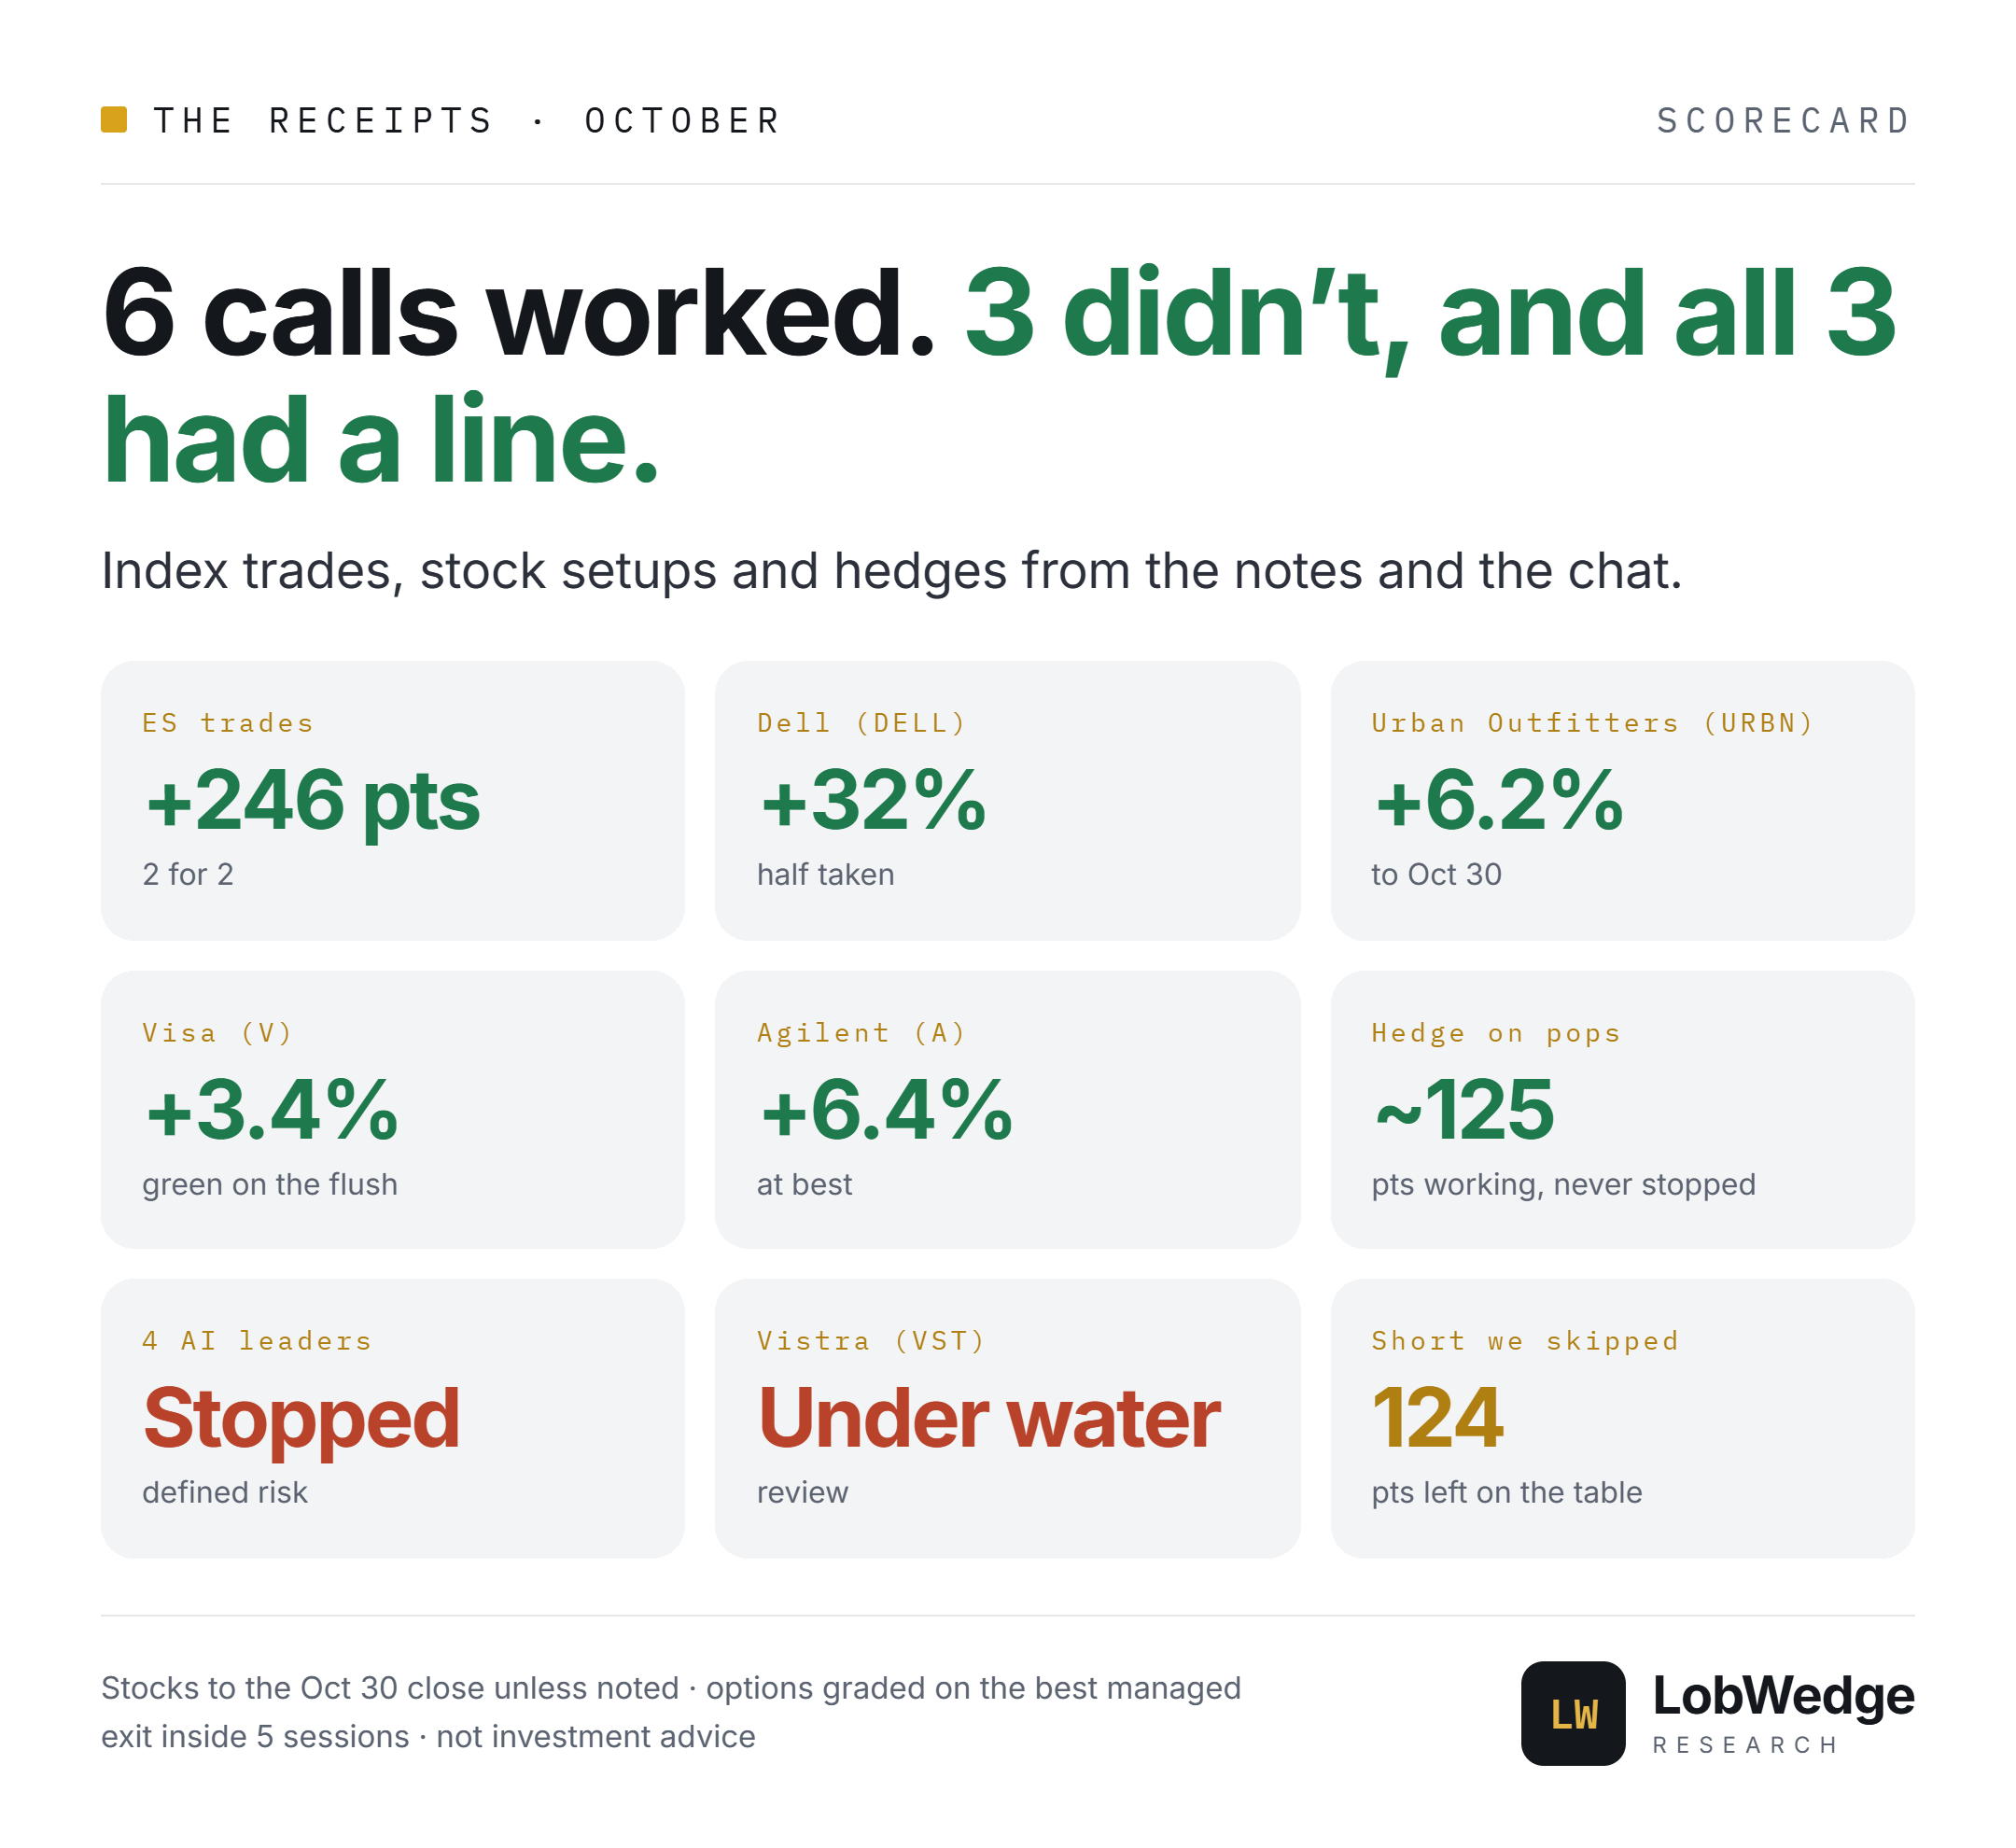
Worked: ES +246 pts. Dell (DELL) call spread, half taken at +32%. Urban Outfitters (URBN) +6.2%. Visa (V) +3.4%, and it closed green on the flush. Agilent (A) up as much as 6.4%.
Didn't: 4 of the 5 AI leaders from October 11 hit their lines when the chip trade cracked. Vistra (VST) is under where we flagged it. Each one had a line and defined risk before it filled.
The learning moment
Most of October's damage came from decisions made in the moment. Ours were made with the market closed:
The entry needs proof. We buy a touch that holds. A level that price is slicing through isn't support.
The exit is a close. On CPI day, 5 pts under the line was enough.
The score caps size before the trade exists. A +1 tape gets half size, no matter how good the setup looks.
Our trader AI on the backend runs these rules the same way every session, and that's how we stick to them when the tape gets loud.
And November started the same way
Nov 2: the failed-rally put spread paid at 7,614 the same afternoon.
Election night: the flush to 7,490 got bought, and the call spread finished at full value.
Nov 5: the AI trade got liquidated and ES fell 392 pts. Our 3.65 hedge finished at 50, 13 to 1, and the entry rule kept us out of the long.
What a paid subscription gets you
The Sunday plan: the full ES map, with entries, targets, the line that says we're wrong, and the odds for each path.
The Wednesday update: the map re-marked for Thursday and Friday.
The score, and the size it allows.
Hedges and stock setups, each with defined risk and a written exit.
Our levels on your own TradingView chart, with an alert at every line.
If you'd rather have the map before the move than the replay after it, this is the time to join.
Not investment advice. Futures and options carry substantial risk. Results are ES points or percent from the published entry, as written in the notes. They aren't account returns and don't include costs.