

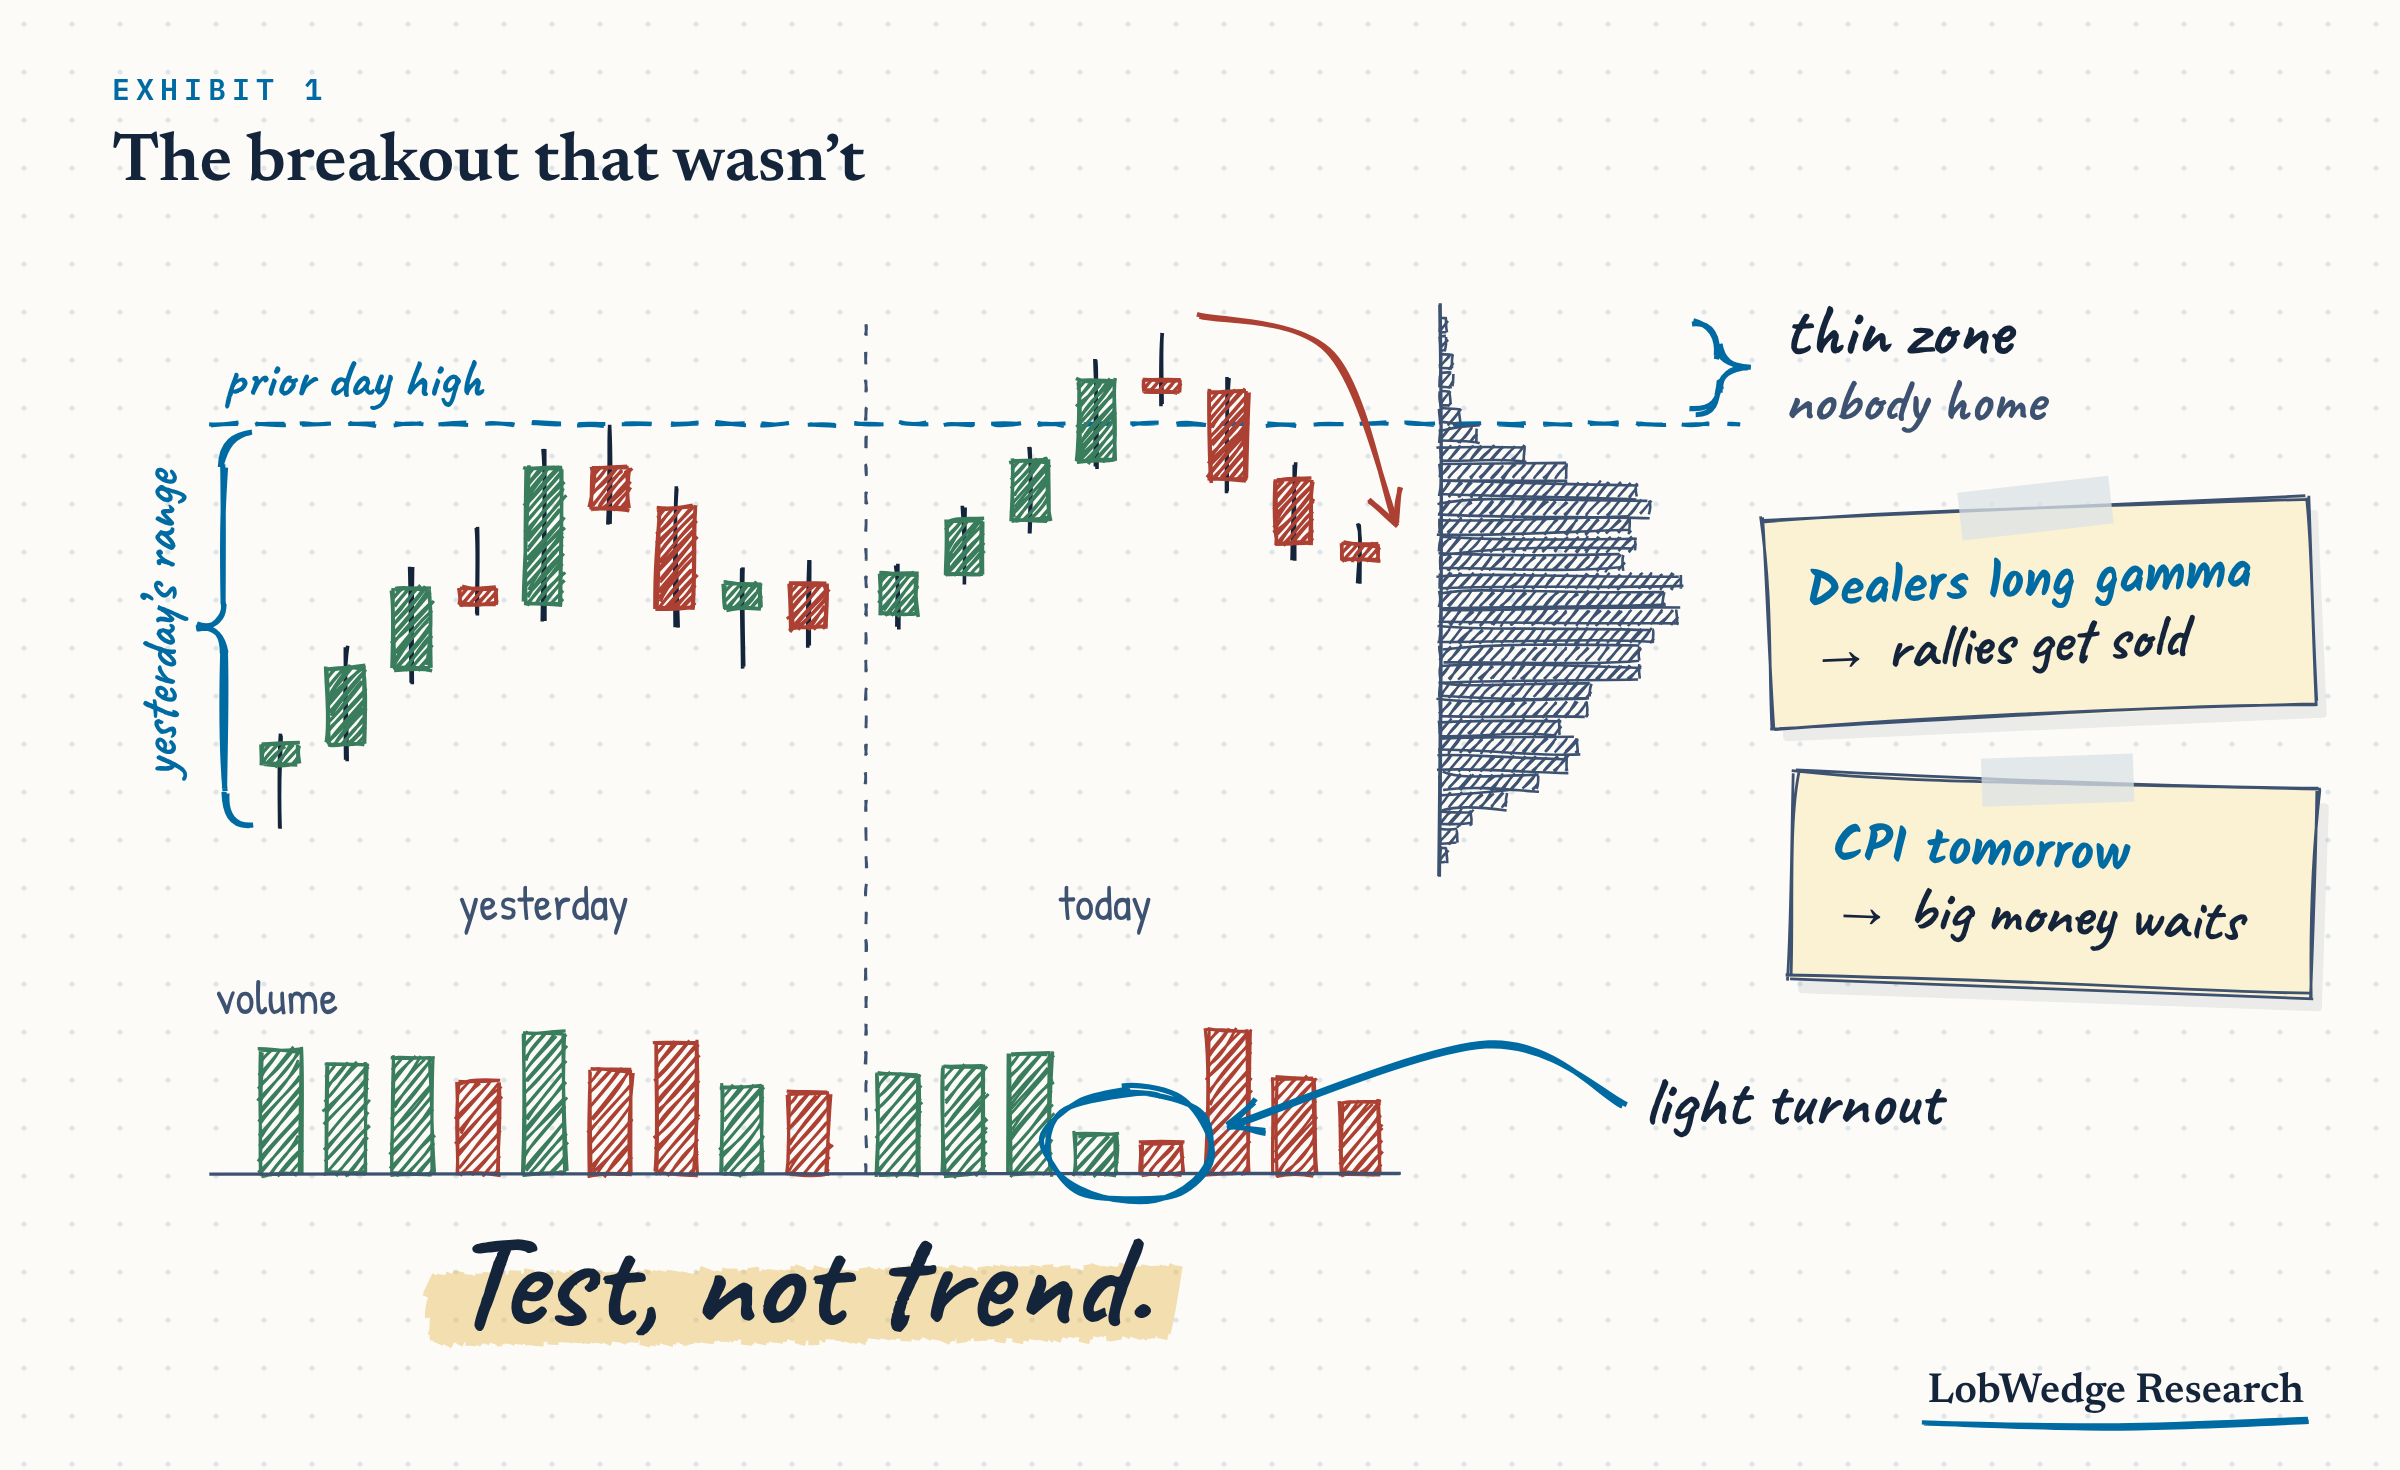
The breakout that wasn’t
It was a little after 10:00 ET and ES had just pushed through the prior day’s high. Clean candle, momentum on the screen, chat lighting up. I bought it.
Twenty minutes later I was out for a loss, and price was back in the middle of yesterday’s range like the breakout never happened.
Afterward the reasons were all sitting there. The push came on light volume, into a thin spot on the profile where nobody had done business the day before. Price was stretched well above VWAP. Dealers were long gamma, so hedgers sold into every rally. CPI was the next morning, so the real money wasn’t going to commit until it printed. Every piece said “test, not trend.” I was only looking at the candle.
This post is about reading the rest of it. We’ll start with how price actually moves, tick by tick, in a market where most of the trading is machines trading with other machines. Then we’ll build the toolkit we use on ES every week: volume profile, VWAP and volume. Then we’ll stack those with the things that tell you when the map is about to change: options positioning, the event calendar and the systematic flows that switch on and off at known levels.
No jargon left unexplained. If you’re new, read it top to bottom. If you run a book, skip to the confluence section and the 5 reads.
How price actually moves
Forget the chart for a minute. Under every ES candle is an order book: a ladder of prices, each with orders waiting on it.
Bids sit below the current price. These are buyers waiting to buy if price comes down to them.
Offers sit above. These are sellers waiting to sell if price comes up to them.
Orders that wait on the ladder are limit orders. They supply liquidity.
Orders that cross the spread and trade right now are market orders. They take liquidity. These are the people in a hurry.
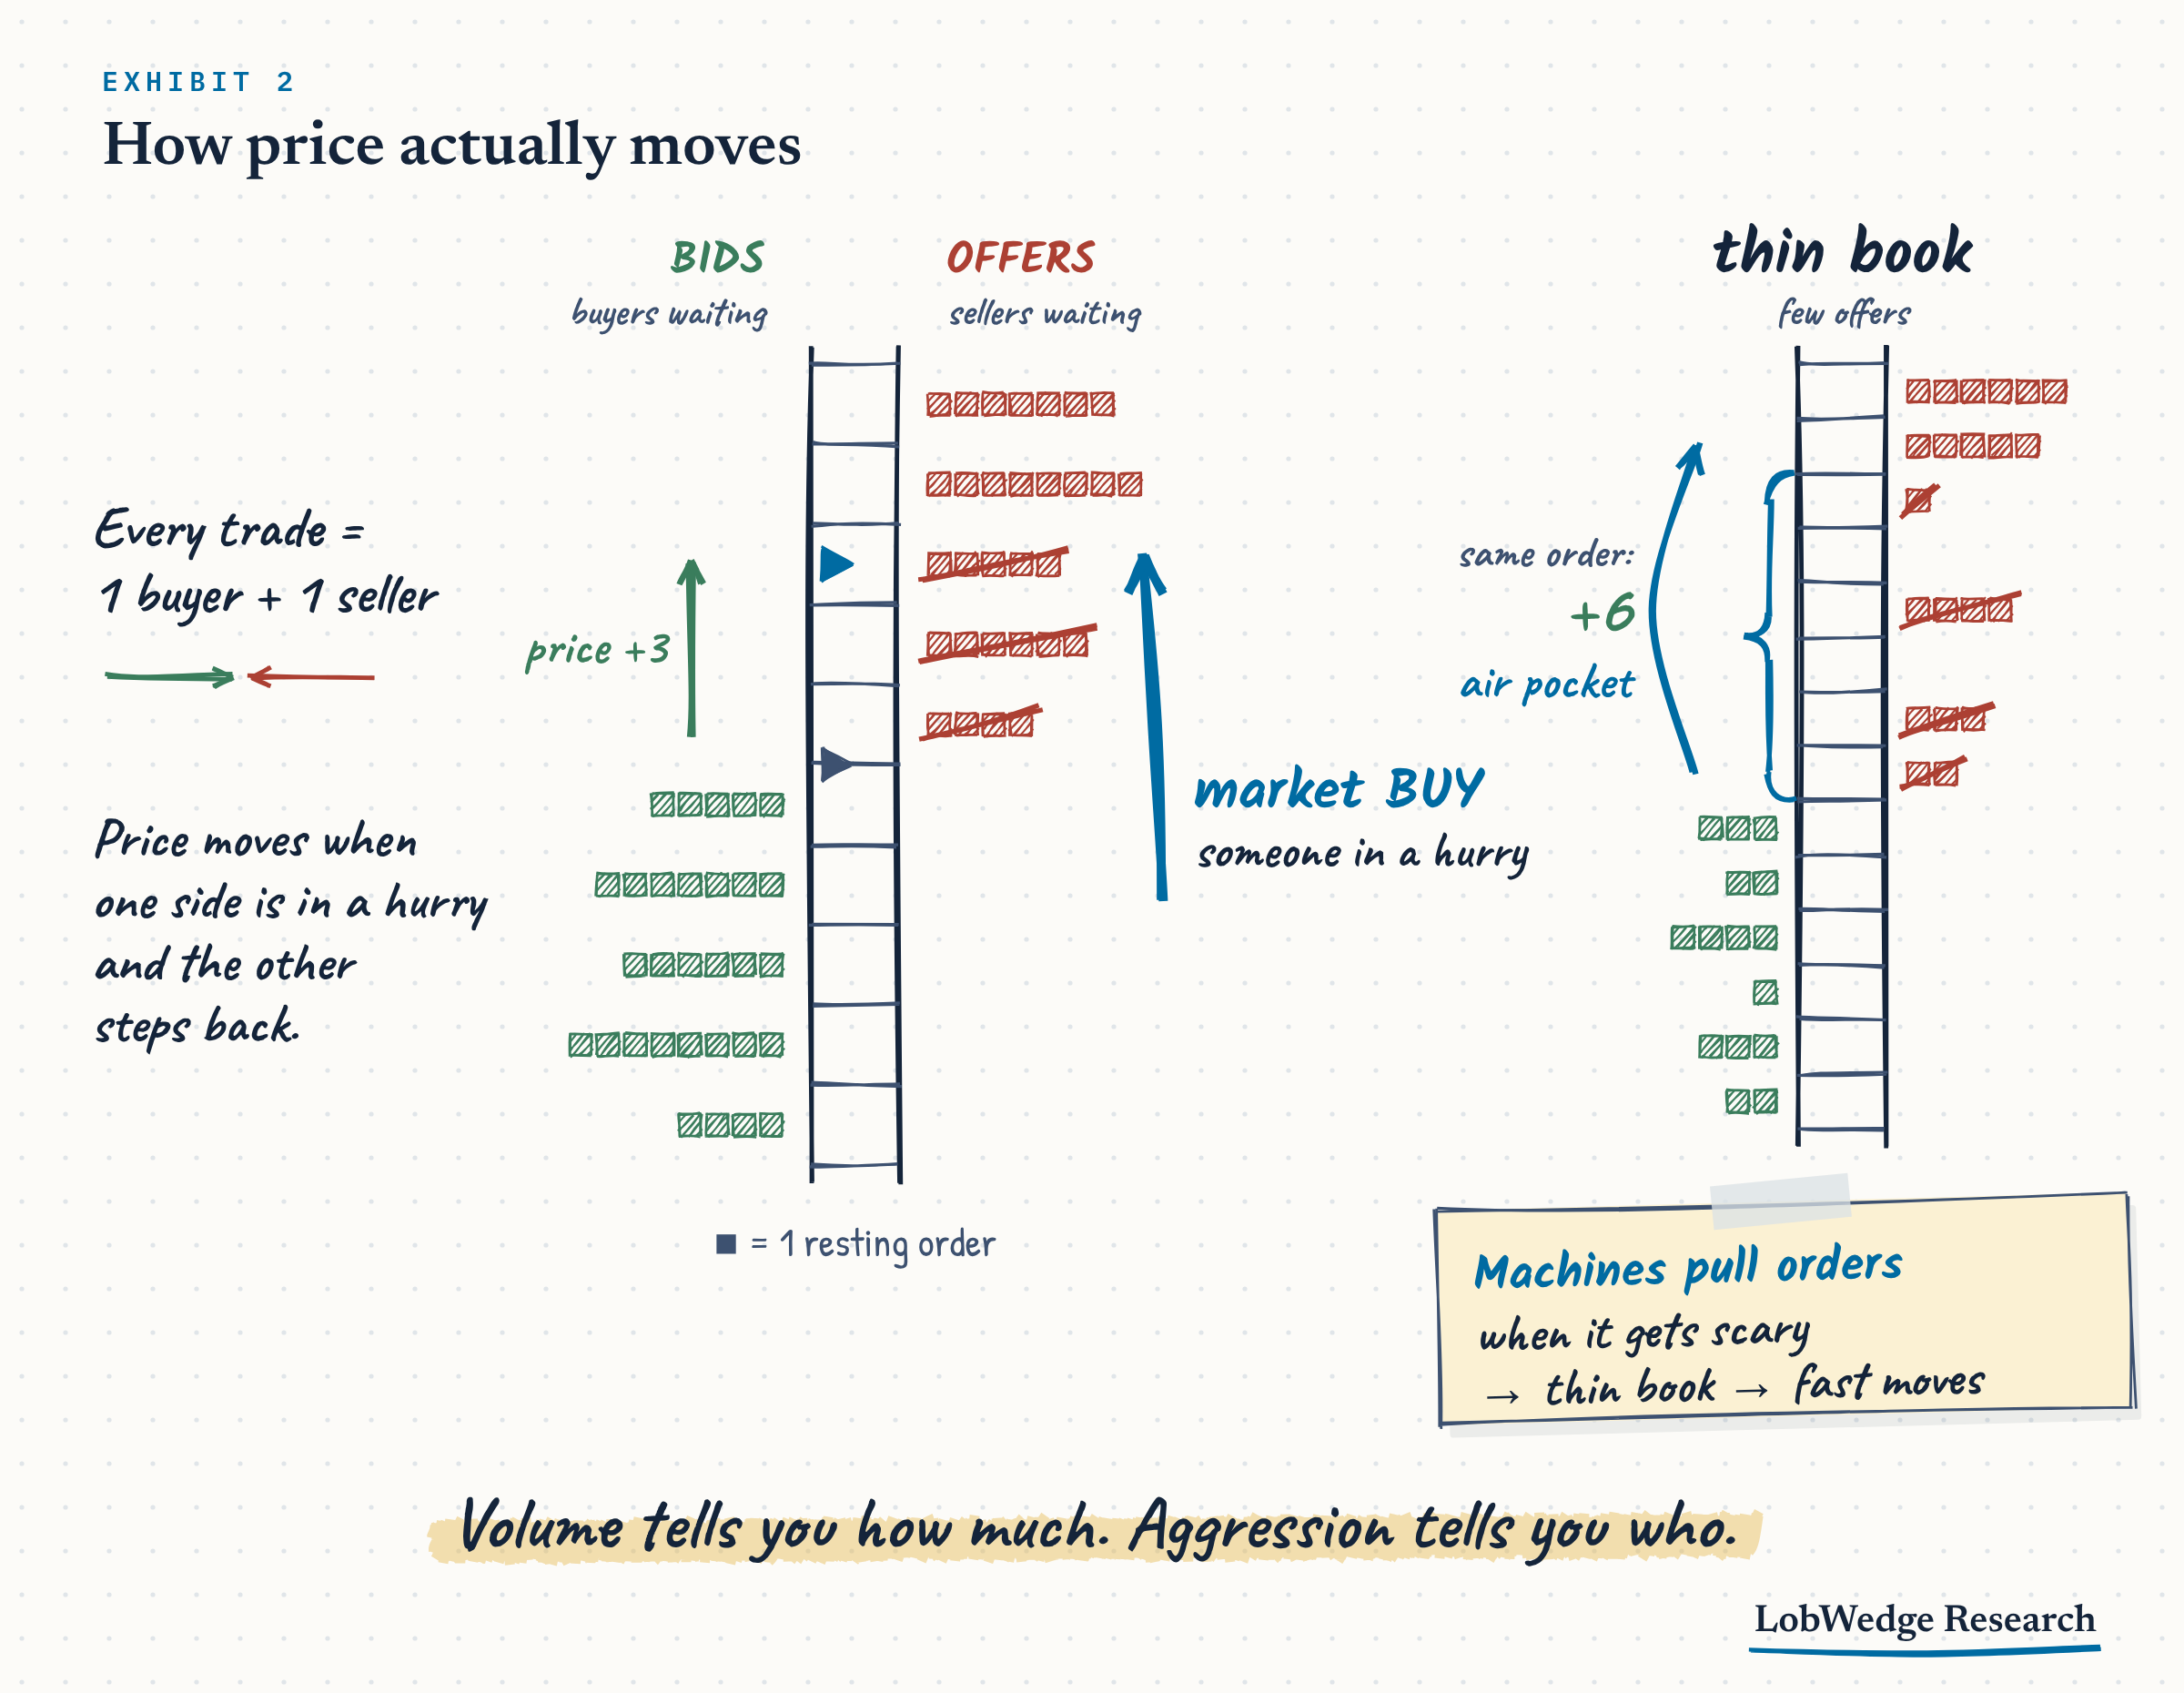
Price only moves when someone in a hurry eats through the orders waiting on one side. A big market buy order lifts every offer at the current price, then the next price up, then the next. Each level it clears is a tick higher. That’s all a rally is, mechanically.
Two things follow, and they matter for everything else in this post:
Every trade has a buyer and a seller. When someone says “there were more buyers than sellers,” that’s never literally true. What they mean is the buyers were more aggressive. They were the ones crossing the spread. Volume tells you how much traded. Aggression tells you who was pushing.
How far price moves depends on how much is waiting. The same order that moves ES 3 ticks in a deep book can move it 6 or more in a thin one. When the book is thin, price moves fast on very little. Those are the air pockets that blow through stops.
A market run by machines
On any given day, most of the orders hitting the ES book come from software, not from a person clicking a button. A lot of what you see on the chart is algos trading with other algos. Here’s who they are:
Market makers post bids and offers all day and earn the spread. When volatility jumps, they widen out or pull their orders. That’s why the book goes thin exactly when you need it.
Execution algos work big orders for funds. A pension buying a large block doesn’t hit the market all at once. Its algo slices the order into thousands of small pieces through the day and is graded on how close it gets to VWAP (more on that below).
High-speed traders react to news, data and other orders in milliseconds.
Systematic funds (trend followers, volatility-targeting funds, risk parity) buy and sell by formula when trend or volatility crosses a threshold.
Options dealers hedge the options the rest of the market buys and sells, and their hedging can either dampen moves or amplify them.
The humans are still there. Long-only funds, pods hedging their books, prop traders, retail. But they mostly act through machines.
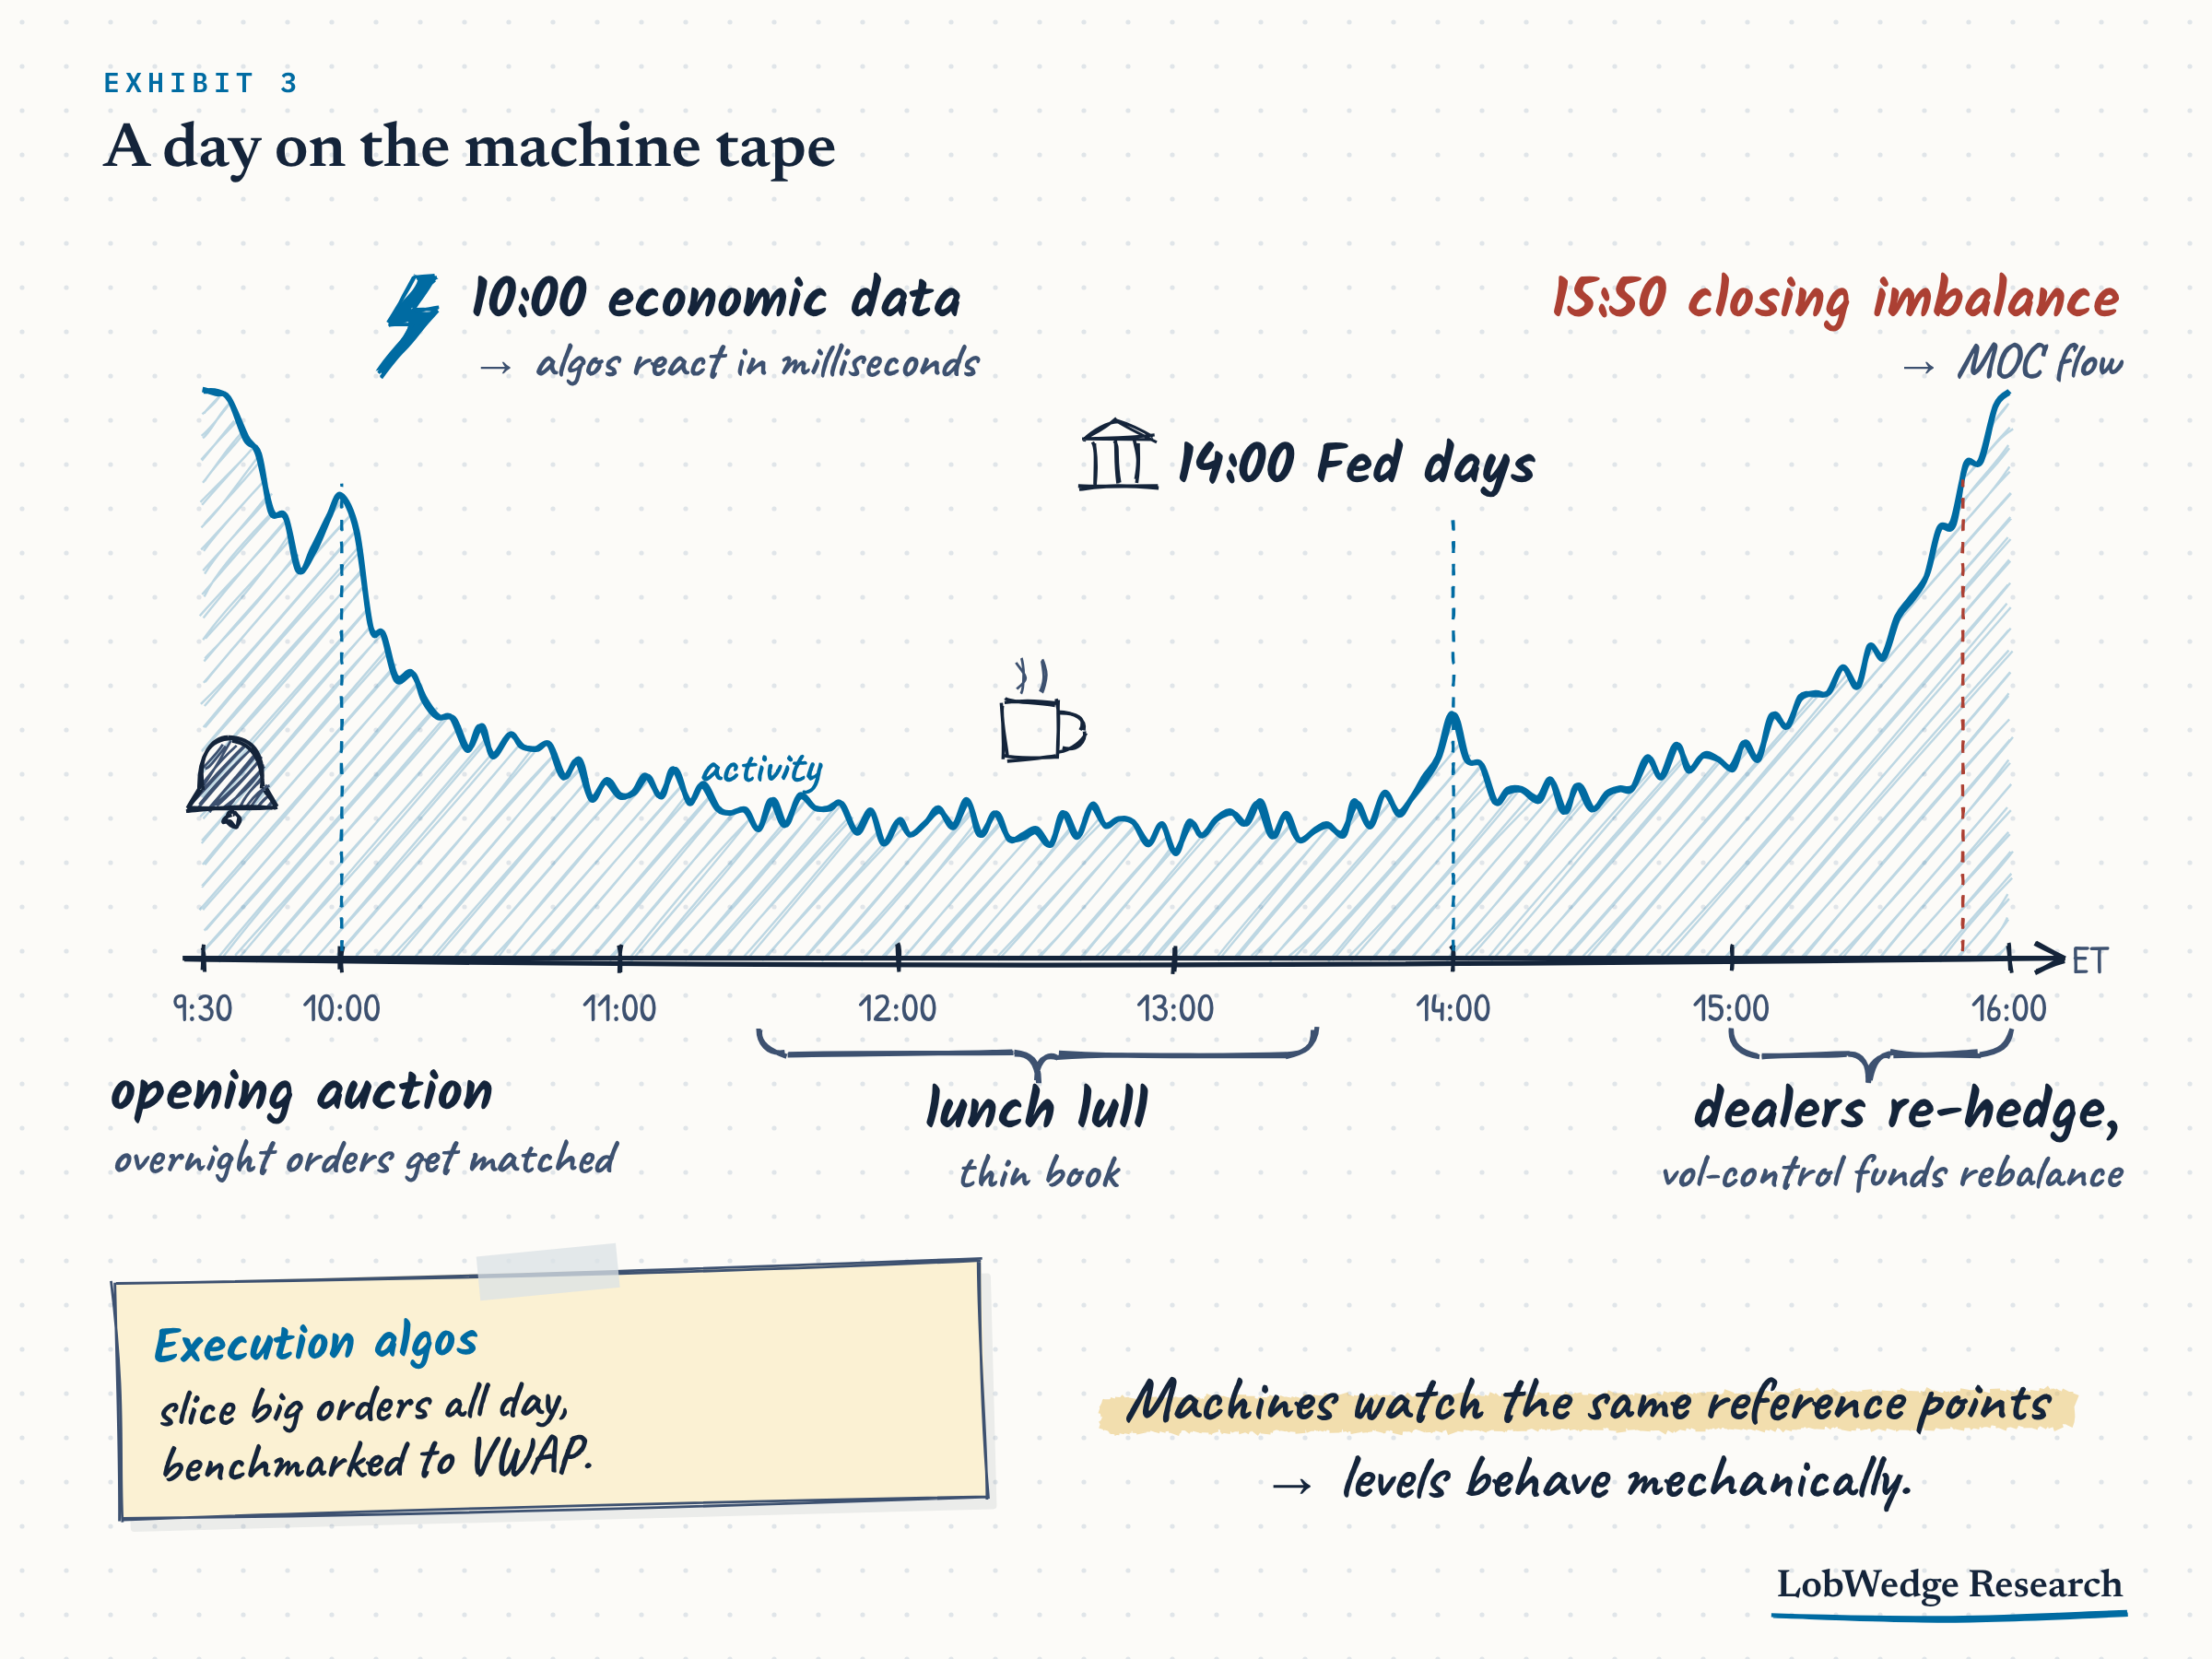
This is why levels work at all. It isn’t magic. Thousands of algos are programmed to watch the same reference points: yesterday’s high and low, VWAP, the prior day’s value area, big options strikes, round numbers. When price reaches one of them, a lot of code wakes up at the same moment. Some of it is set to buy, some to sell, some to pull its orders. That’s why price so often stalls, snaps back or rips right at a level. The reaction is mechanical.
The session has a rhythm too. The open is heavy as overnight orders get matched. 10:00 ET data hits, and algos reprice in milliseconds. Lunch is quiet and the book is thin. Fed days add a 2:00 pm spike. The last hour is the busiest: dealers re-hedge, volatility-targeting funds rebalance, and at 3:50 pm the exchange publishes the closing imbalance, which pulls in another wave of orders. A move at 12:30 and the same move at 3:45 are not the same signal.
The practical takeaway: read price at the reference points, at the times the machines are active. Everything in between is mostly noise.
The map: volume profile
A normal chart shows price against time. A volume profile shows how much traded at each price.
Here’s how it’s built. Every time a contract trades, put a mark next to the price it traded at. Do that for every trade in a day or a week, then stack the marks sideways. You get a histogram on the side of the chart: long bars where a lot of business got done, short bars where almost nothing traded.
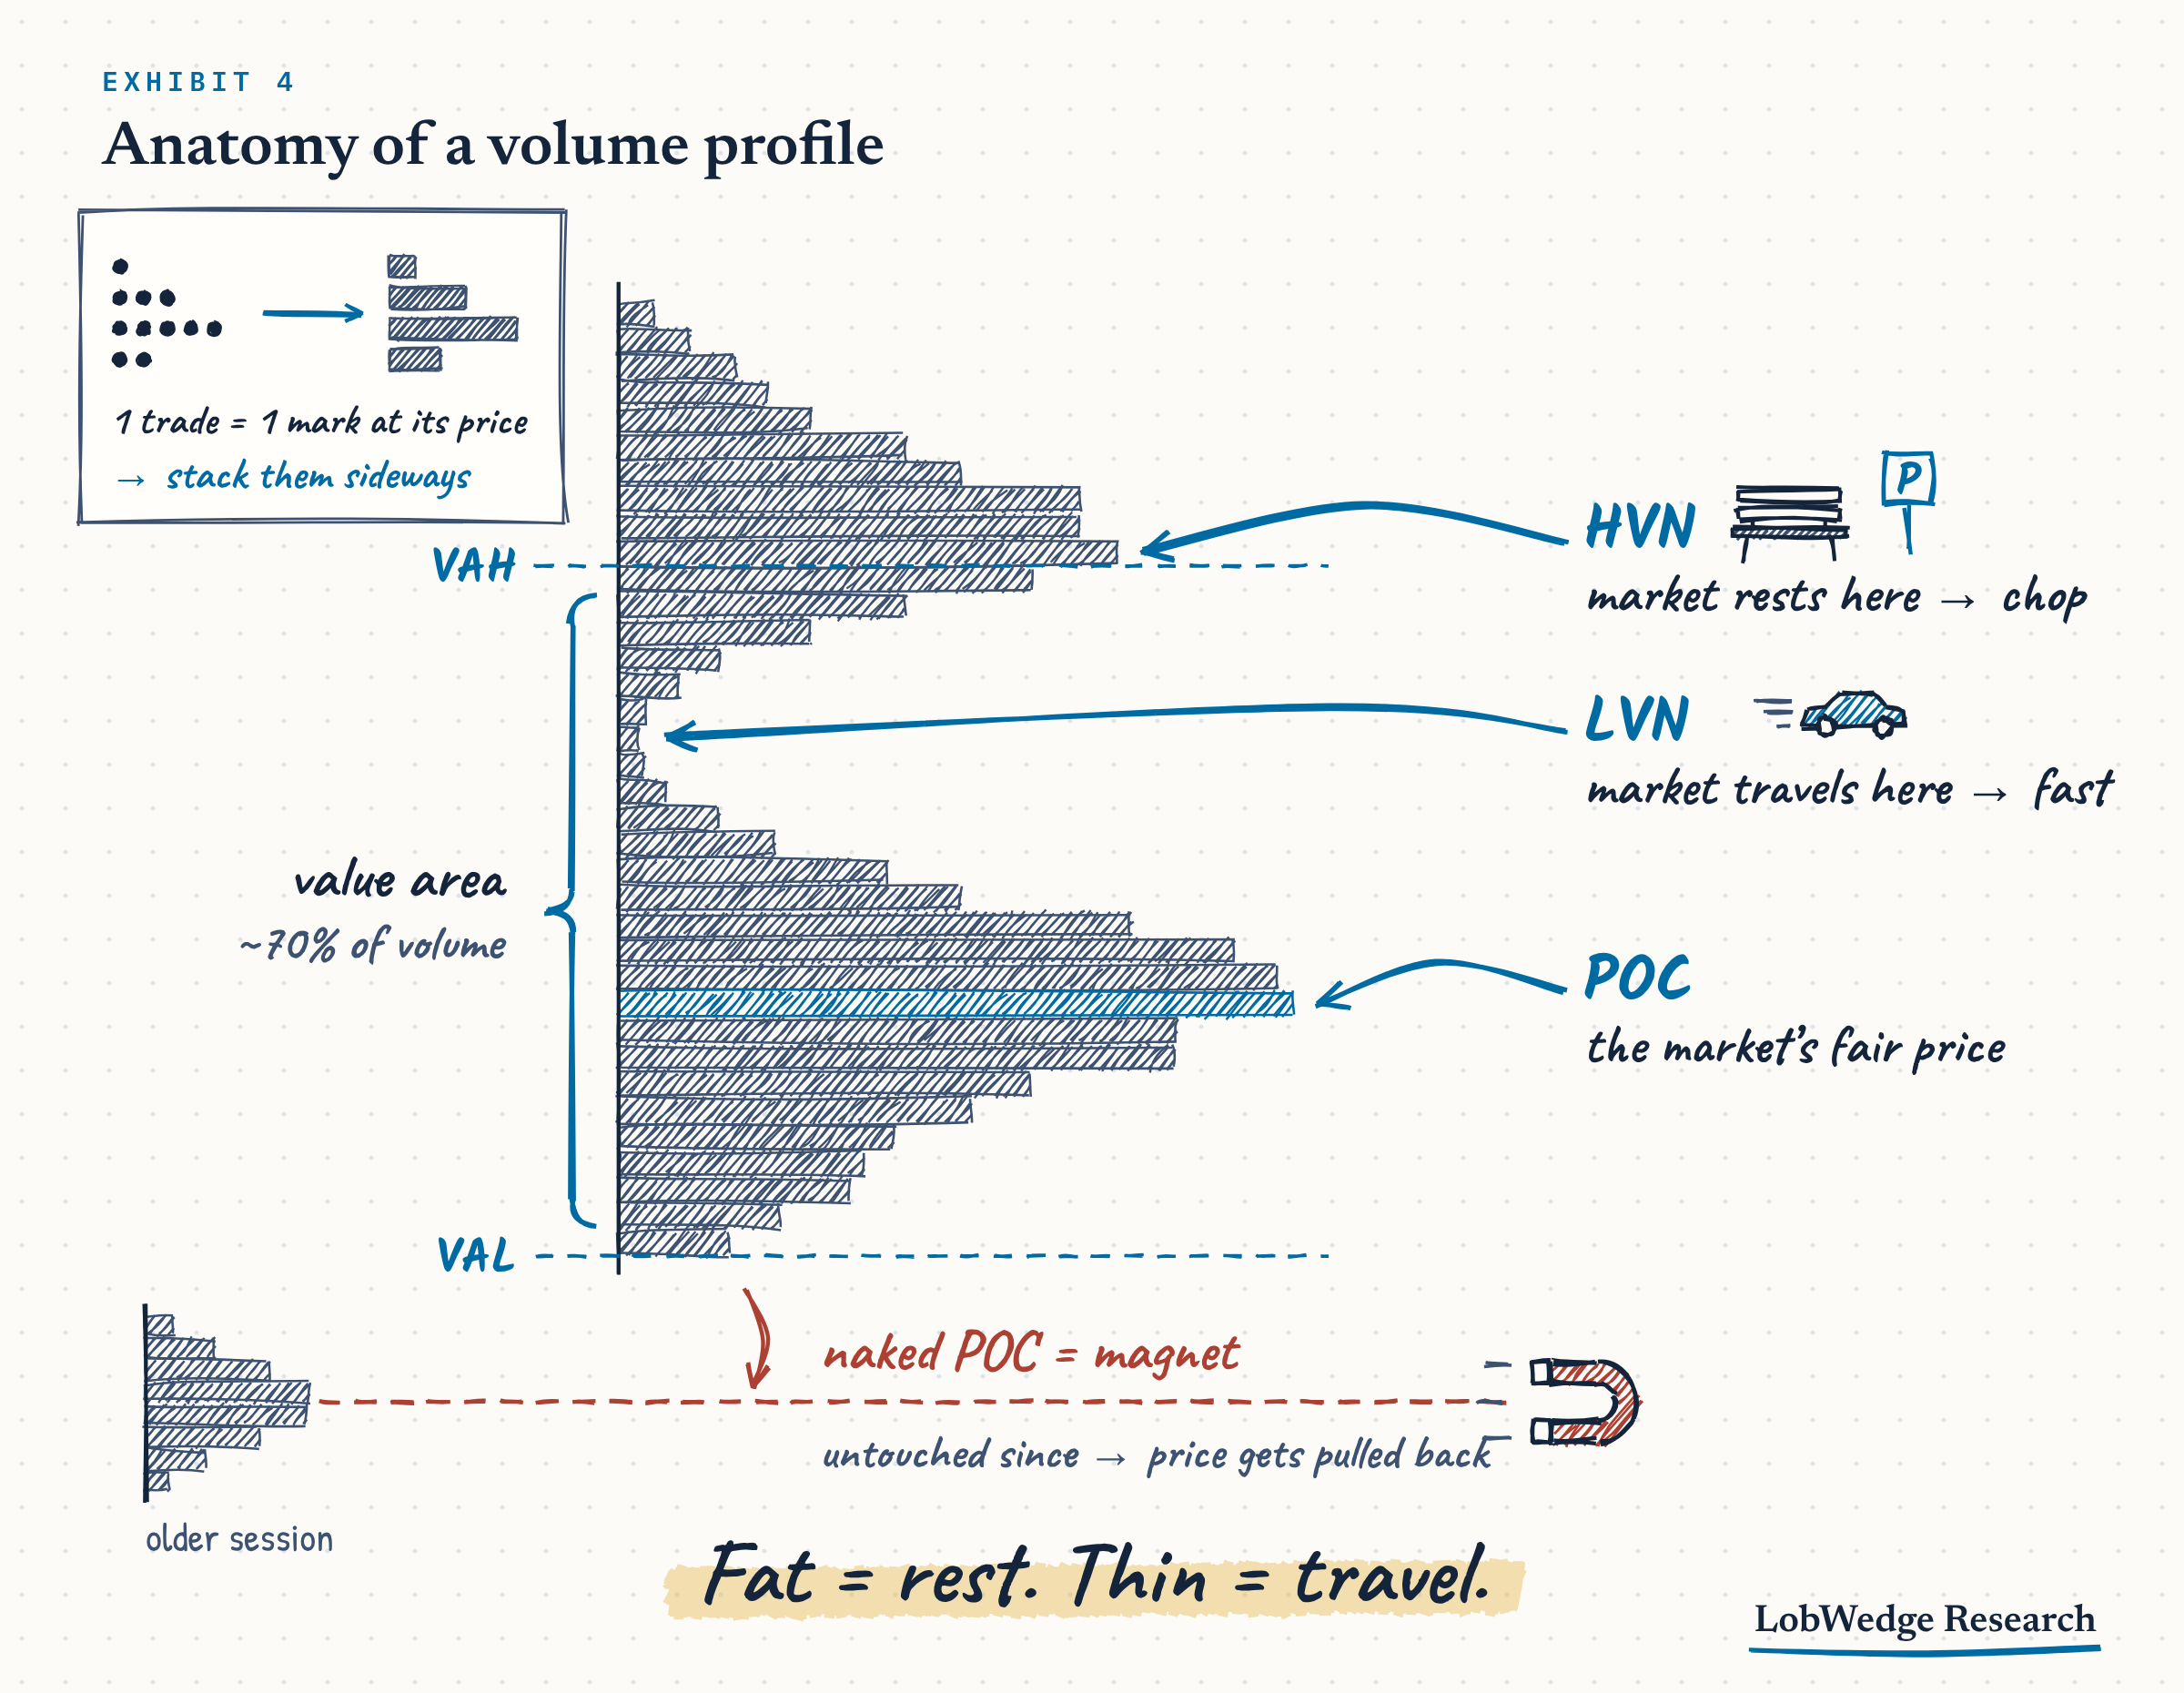
That shape is a map of where buyers and sellers agreed on price and where they didn’t. You only need 5 terms to read it.
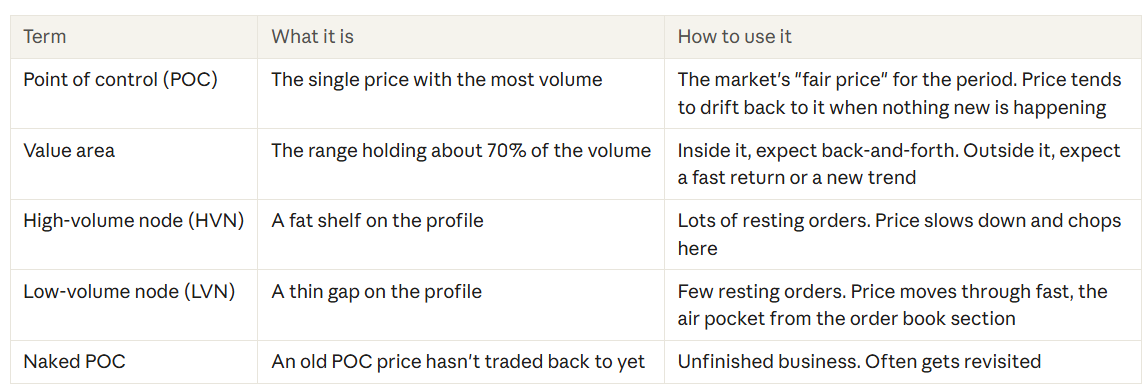
Notice how this connects to the order book. A fat shelf is where lots of orders have been waiting, so price takes effort to push through. A thin gap is where very few were waiting, so the same push goes much further. Fat is where the market rests. Thin is where it travels.
Timeframe matters. A daily profile tells you about today. A weekly profile shows where the bigger money has done business, and those zones hold up better. We use the weekly as the map and the daily to time entries.
VWAP: the day’s scoreboard
VWAP stands for volume-weighted average price. Take every trade since the session opened, weight each price by how many contracts traded there, and average it. The result is one line on your chart: the average price everyone has paid today.
It matters because of who uses it. Remember the execution algos slicing big orders for funds? Most of them are graded against VWAP. A fund that bought below VWAP got a good fill. One that paid above it overpaid. So a huge amount of size gets worked near that line every day, and the machines doing it watch it constantly.
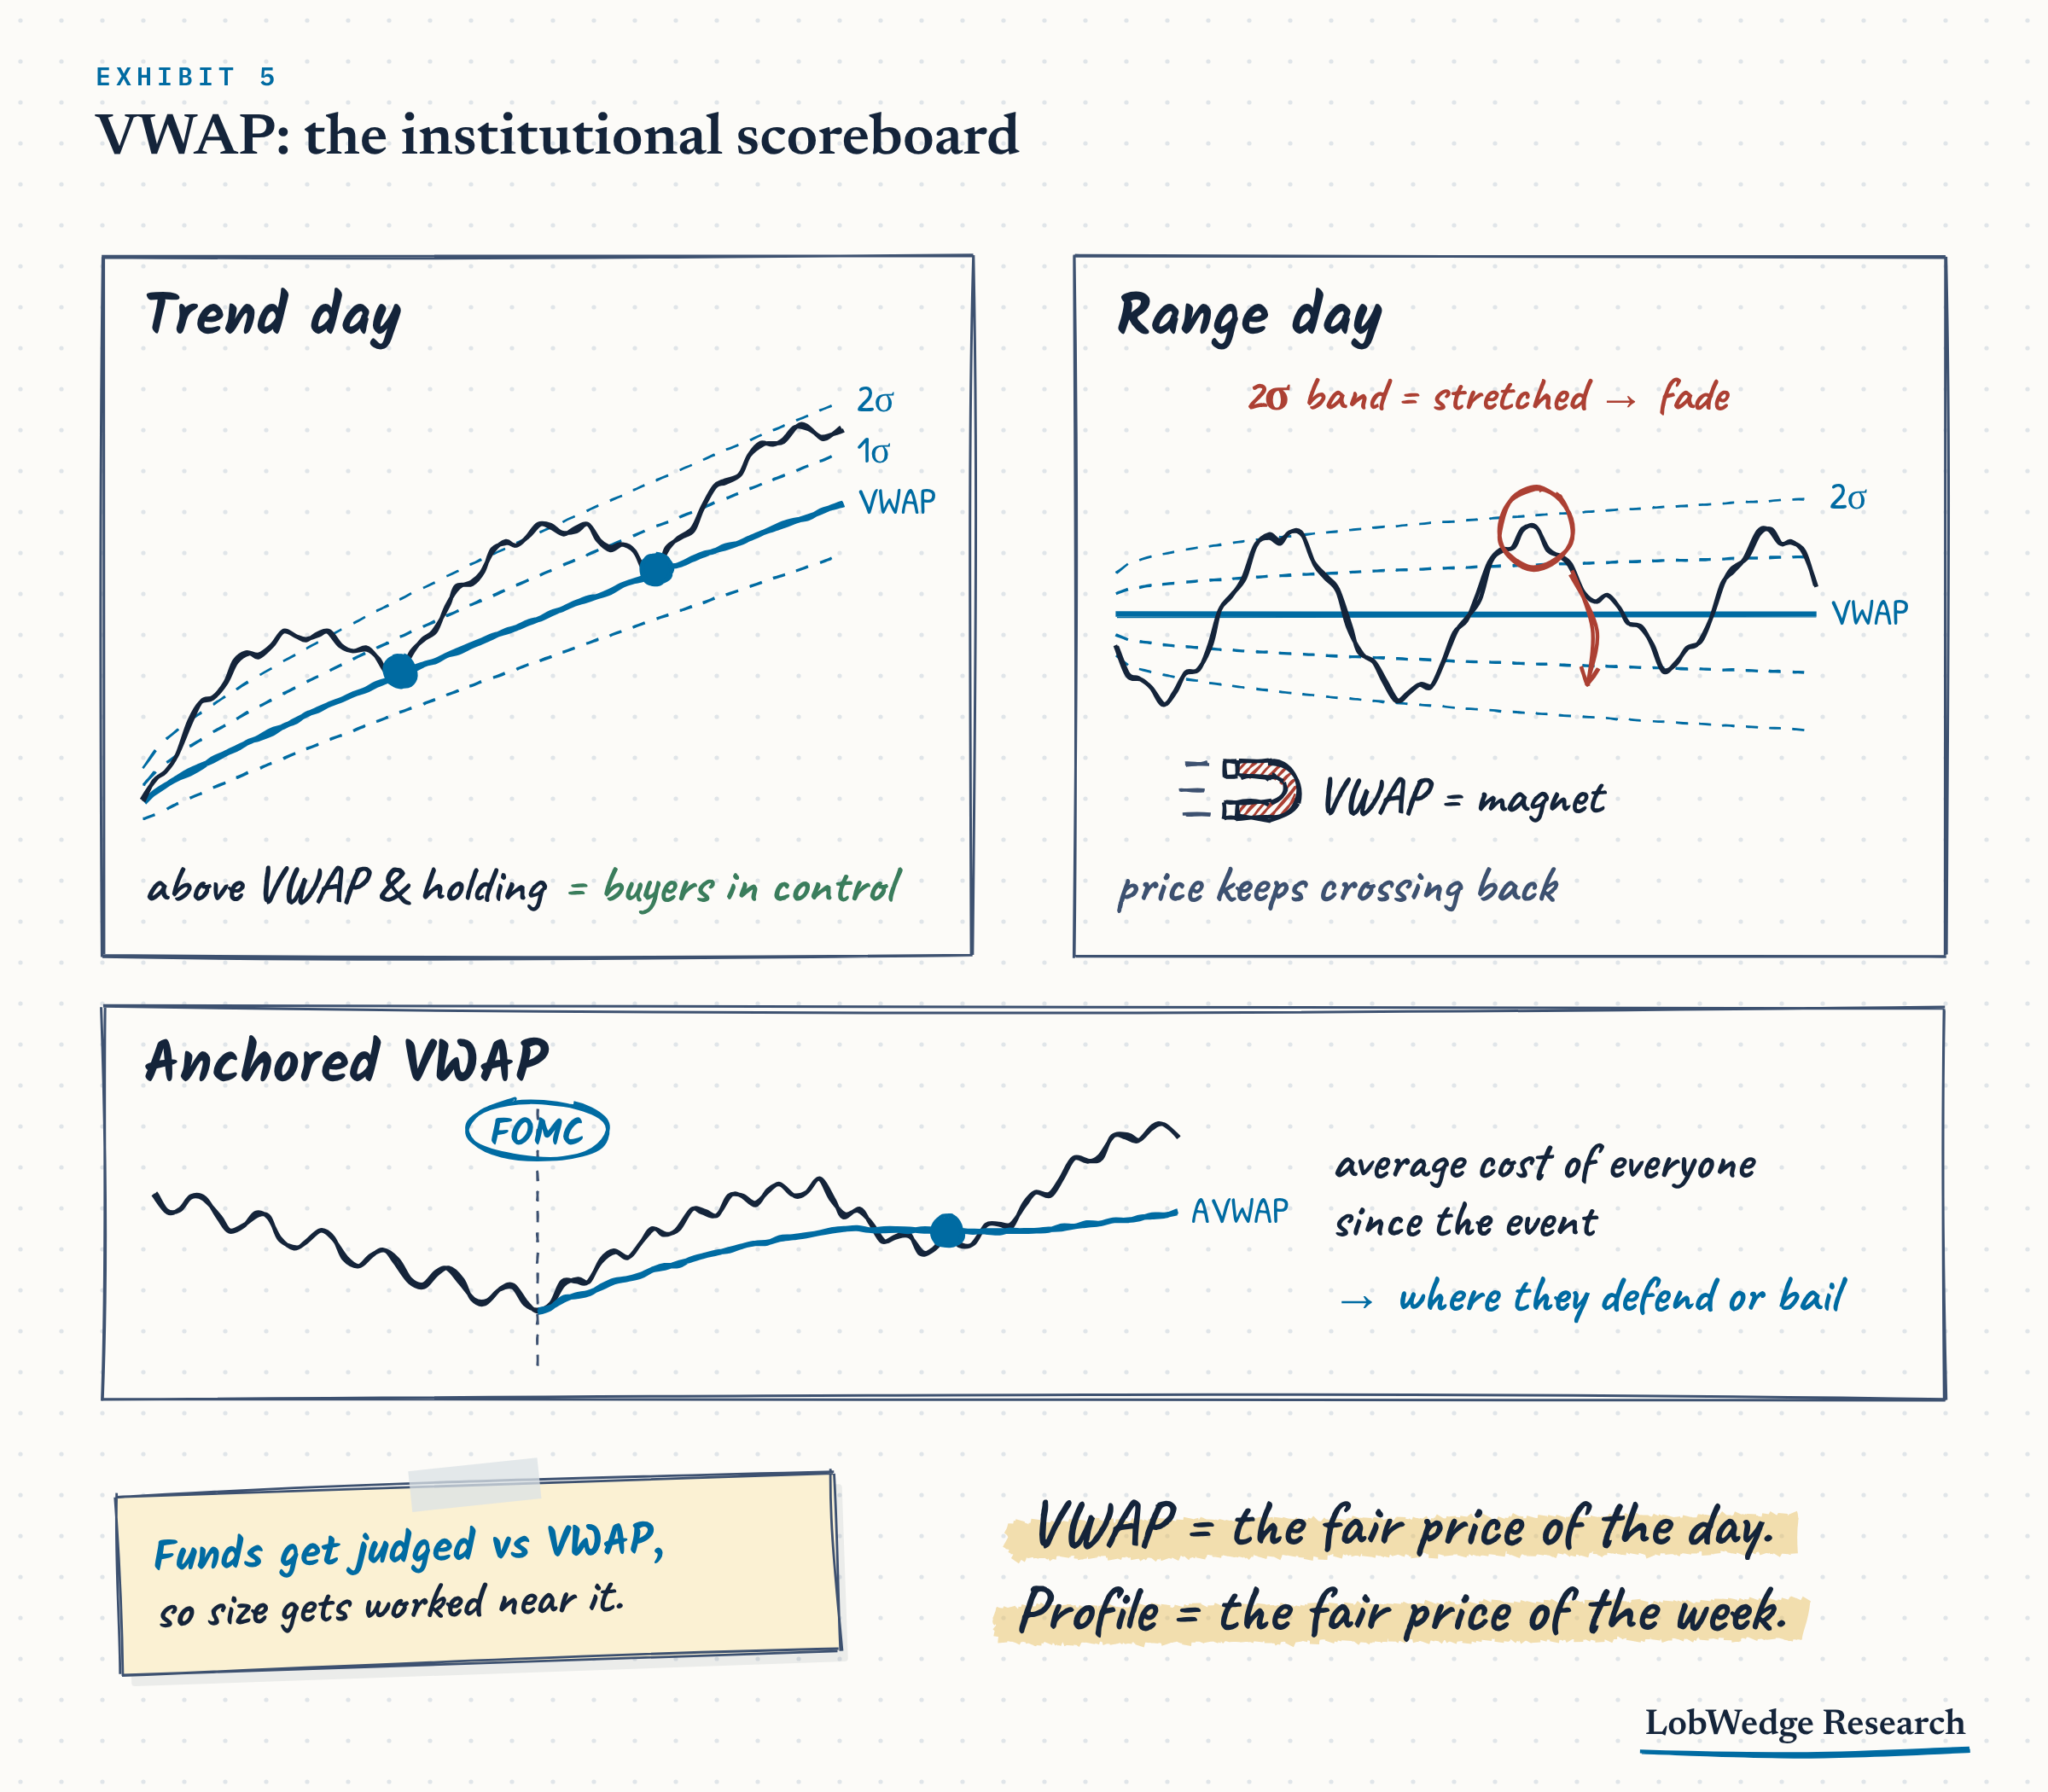
How we read it on ES:
Above VWAP and holding = buyers in control for the session. On a trend day, pullbacks to VWAP get bought and price rarely closes below it.
Below VWAP and holding = sellers in control. Same thing upside down.
Crossing back and forth = a range day. VWAP acts like a magnet and edge trades work better than breakouts.
The bands. Many platforms draw lines 1 and 2 standard deviations above and below VWAP. On a range day, a tag of the 2σ band means price is stretched, and fading it back toward VWAP is a reasonable trade. On a trend day, price can ride the 1σ band for hours, so don’t fade it.
A reclaim or a loss of VWAP after a failed move is often the first sign the day has changed character.
There’s also anchored VWAP. Instead of starting the average at today’s open, you start it at a moment that mattered: an FOMC decision, a big low, a gap. That line is the average cost of everyone who traded since that event. When price comes back to it, those traders are at breakeven, and they tend to either defend it or bail out. Either way, something happens there.
The simple way to hold these together: VWAP is the fair price of the day. The profile is the fair price of the week. When the 2 line up at the same spot, pay attention.
Volume: reading the vote
The profile shows where business got done in the past. Volume shows how much is getting done right now. Think of each bar as an election and volume as turnout. A move on heavy turnout is a mandate. A move on light turnout is a rumor.
The cleanest way to read it is effort versus result. Volume is the effort. How far price travels is the result. They should match. When they don’t, that mismatch is the information.
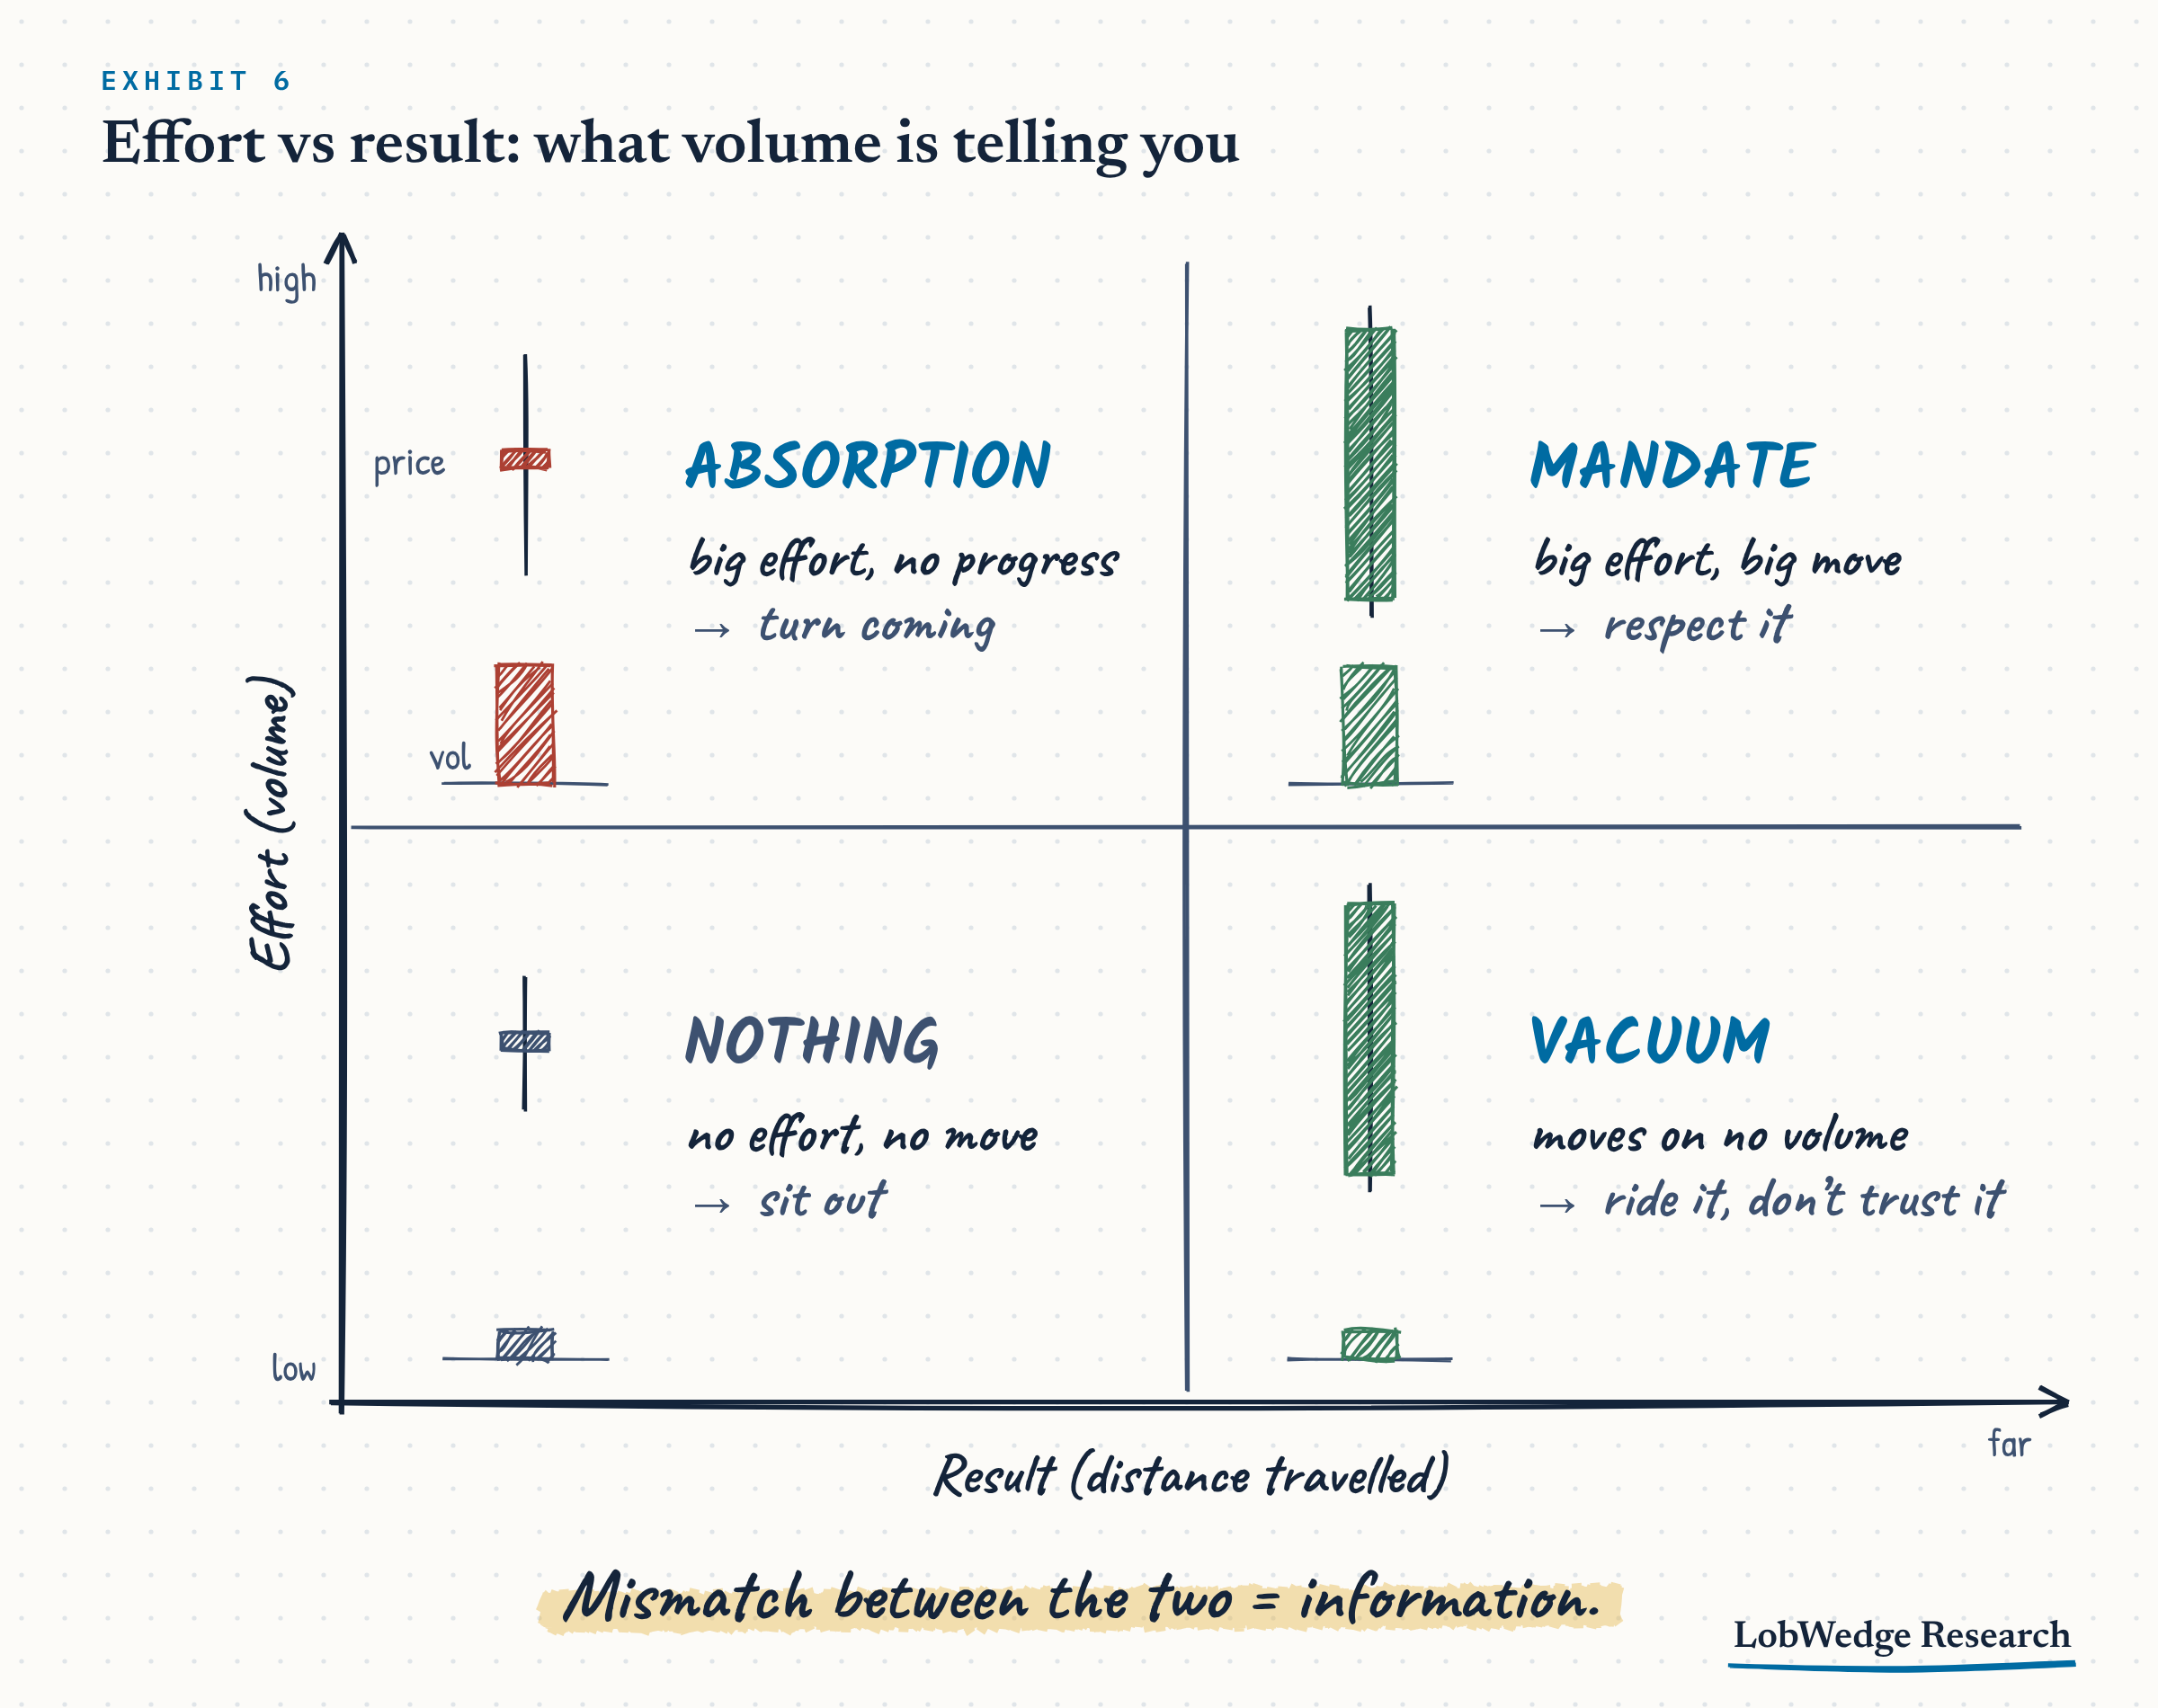
Big effort, big result = mandate. Heavy volume and a wide bar that closes near its extreme. Real participation. Respect it.
Big effort, small result = absorption. Heavy volume but the bar goes nowhere. Someone big is soaking up every order with resting limit orders. This often marks a turn.
Small effort, big result = vacuum. Price travels far on light volume, usually through a thin zone. Fine to ride, but don’t trust it to hold until real volume shows up.
Small effort, small result = nothing. Don’t force a trade.
2 habits keep this honest:
Compare volume to its normal for that time of day. ES volume is naturally heavy at the open and close and light at lunch (look back at the machine tape). A breakout at 2x the normal volume for 10:30 is a different animal than one at 0.6x. This ratio is called relative volume, or RVOL.
Watch where the heavy volume prints inside the bar. If the heaviest trading in a breakout bar happens at the top and price holds there, buyers are winning. If it happens at the top and price falls back, buyers got trapped up there, and that trapped volume becomes resistance next time.
The opening trade was a vacuum: small effort, into a thin zone, with nobody new showing up. The tape was telling me. I wasn’t asking it.
Why ES is built for this
These tools work best where the auction is truly 2-way, and ES is about as 2-way as markets get. Pods hedge their stock books with it. Long-only funds use it to adjust exposure fast. Dealers hedge SPX options with it. Systematic funds rebalance through it. It trades nearly around the clock. With that many players needing the opposite side, price spends real time building value, and the edges of value mean something.
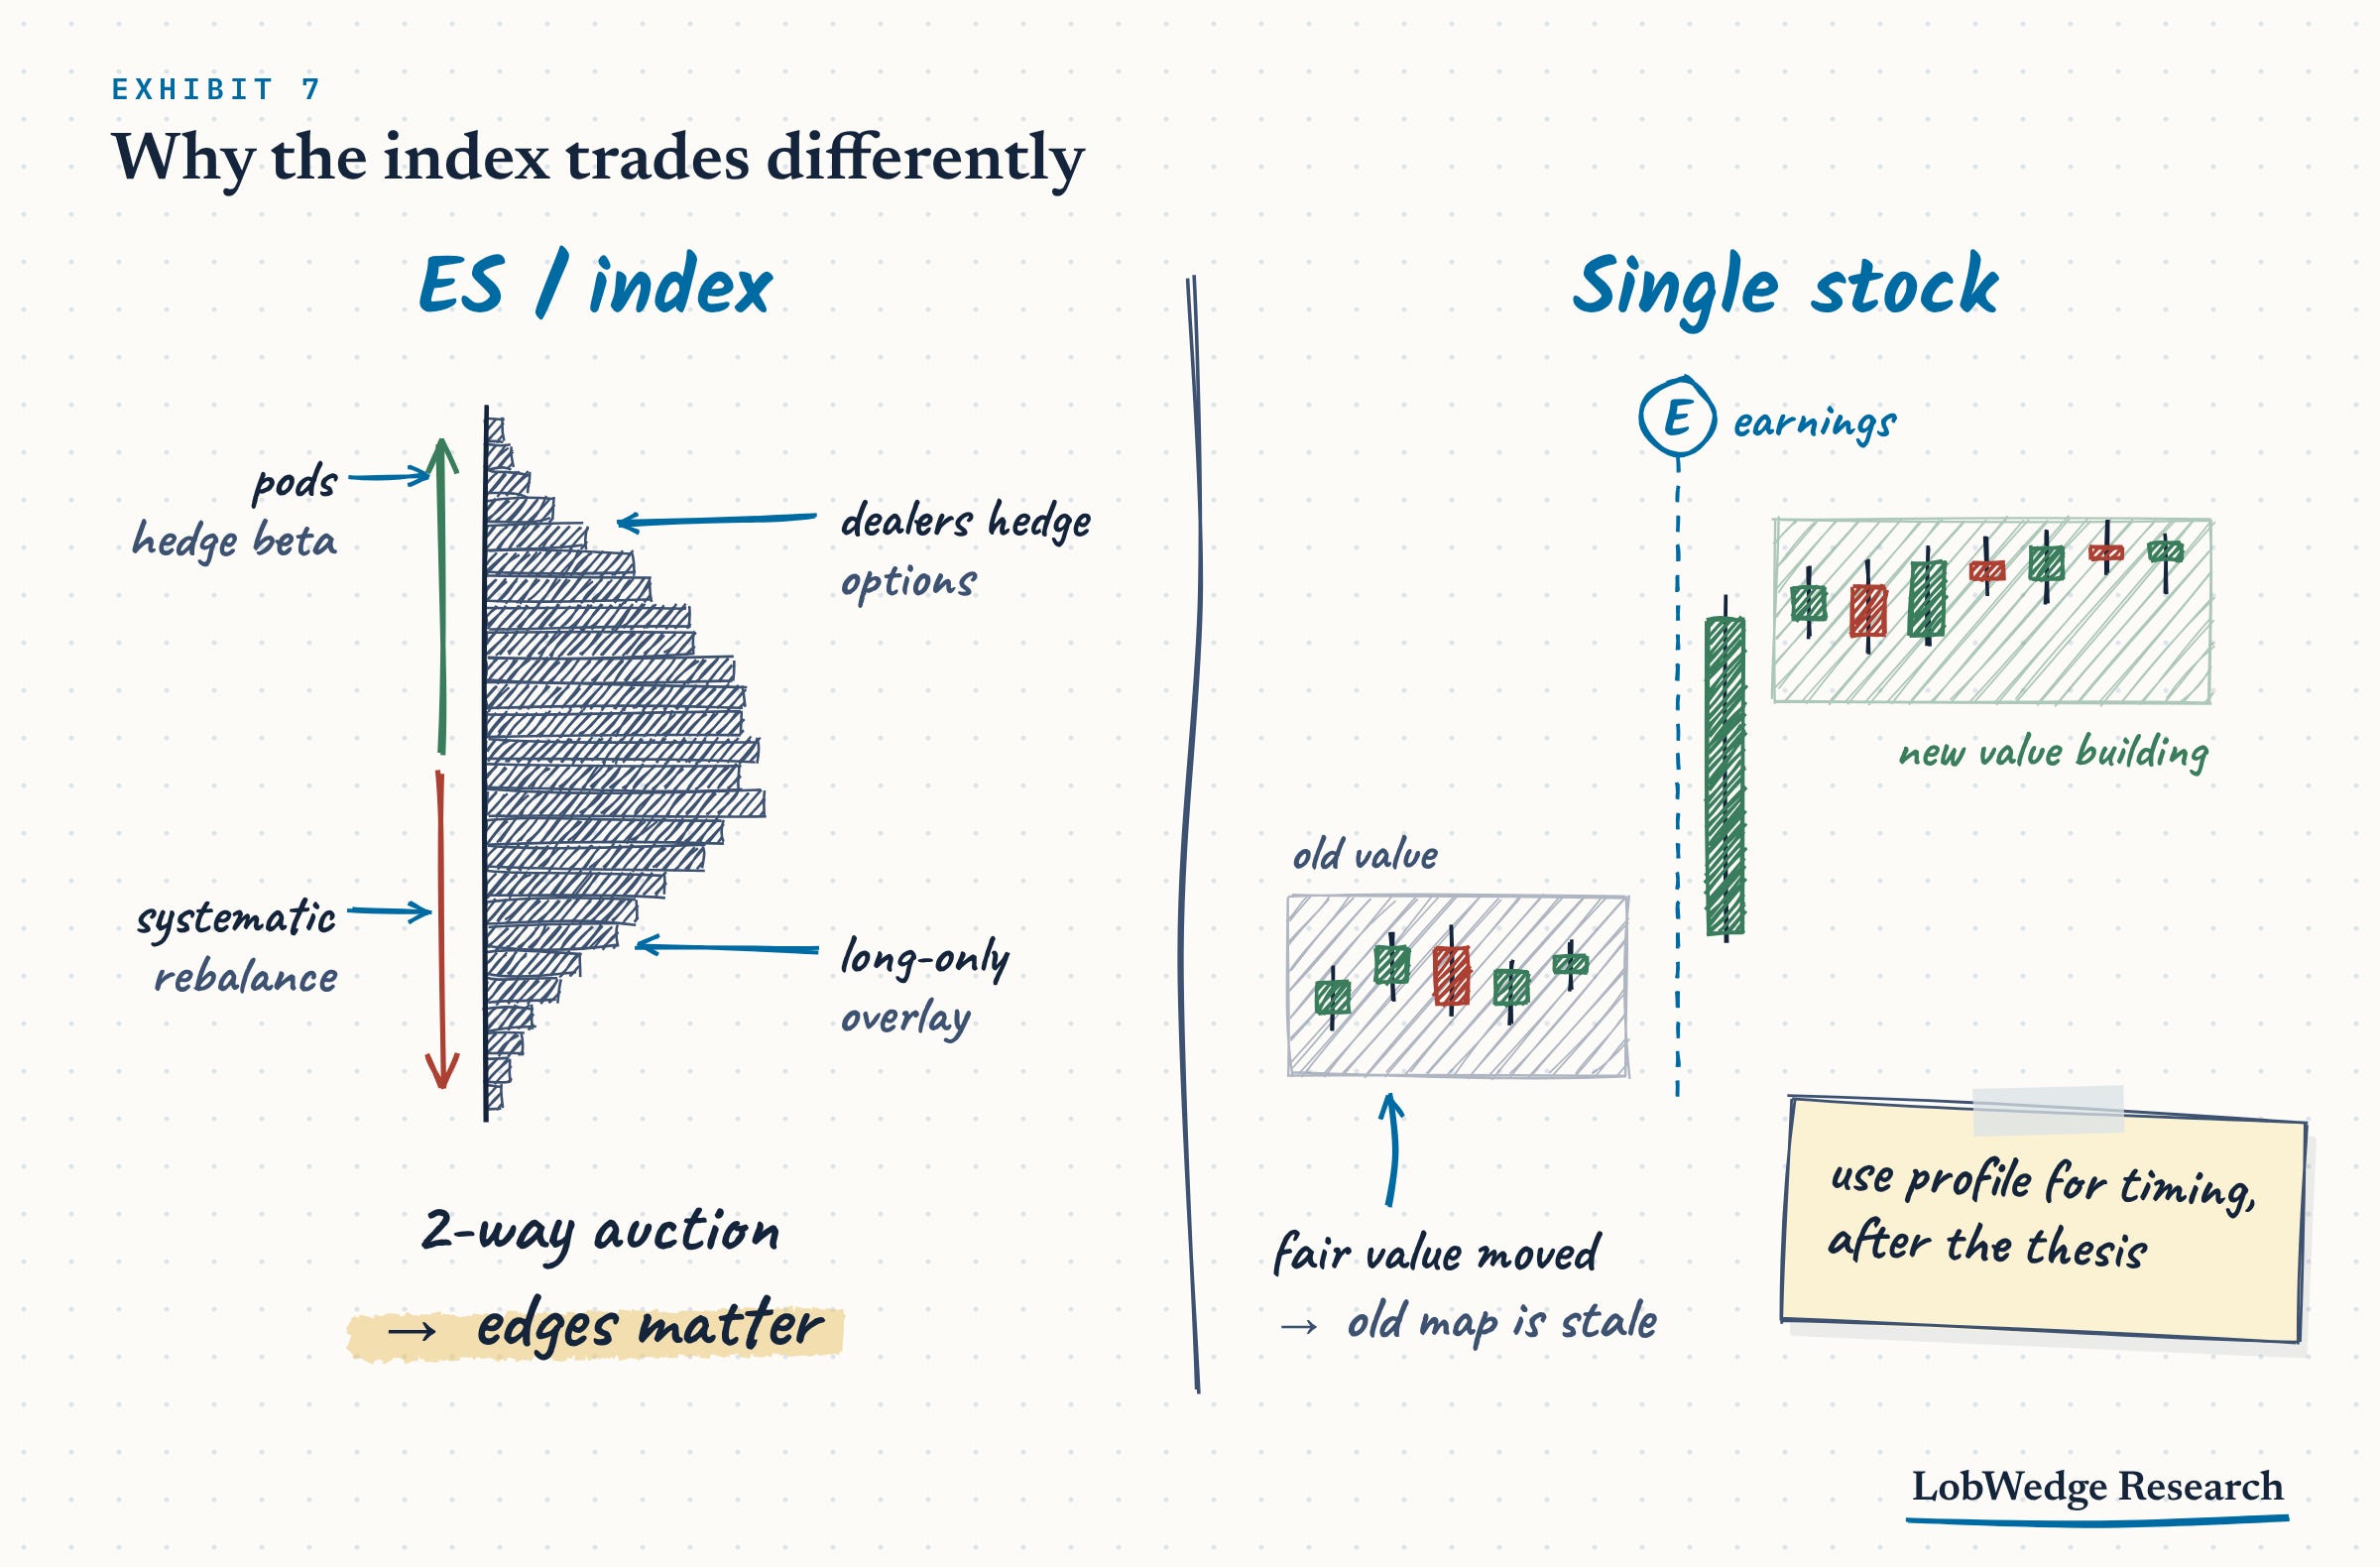
A single stock is different. It reprices on information: an earnings print, a guide cut, a downgrade. When fair value itself moves, yesterday’s profile stops mattering. If you trade stocks, these tools still help with timing once your fundamental case is set, but on ES they’re close to the main event. That’s why our work starts there, and why the ES read is the risk dial for everything else: when ES is accepting higher prices with supportive flows, it’s a better environment to press longs anywhere. When it’s rejecting at the edges, that’s where you hedge or stop adding.
Confluence: what we stack on top of the map
Profile, VWAP and volume tell you where the market agrees and whether it’s accepting a new price. They don’t tell you why, or when the agreement is about to break. A level on its own is a hypothesis. We trust it when other inputs point the same way at the same price.
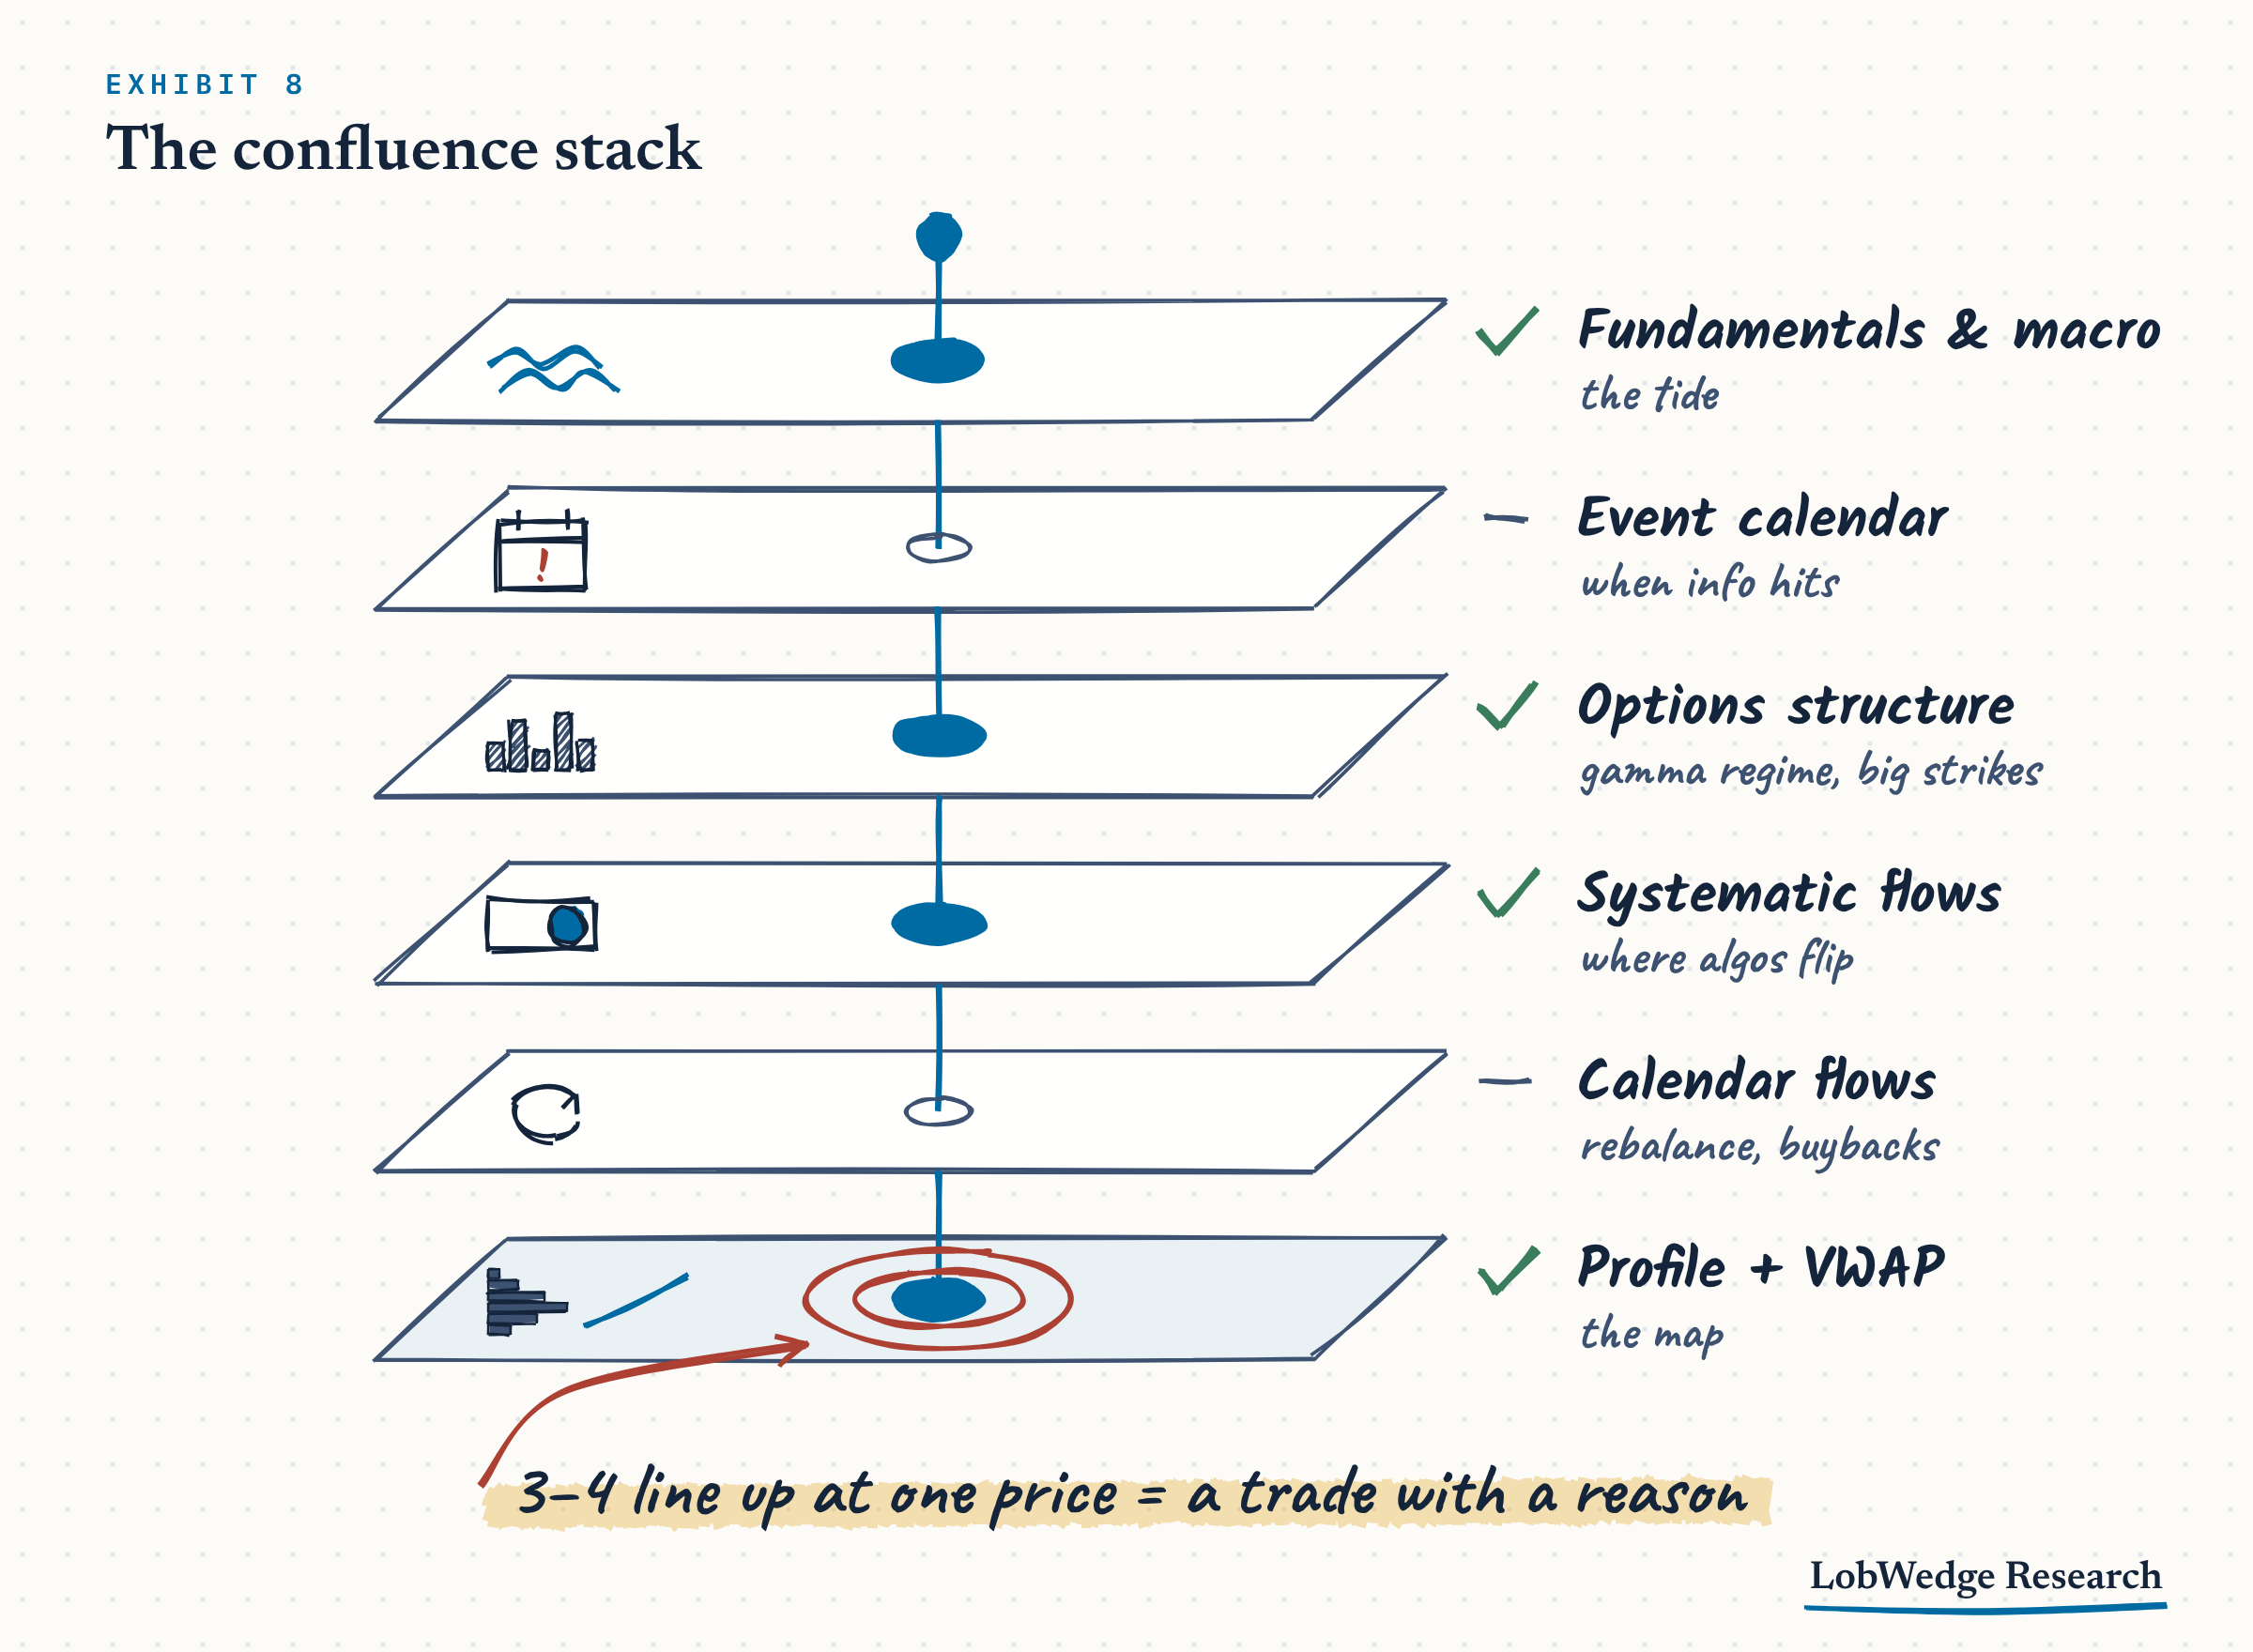
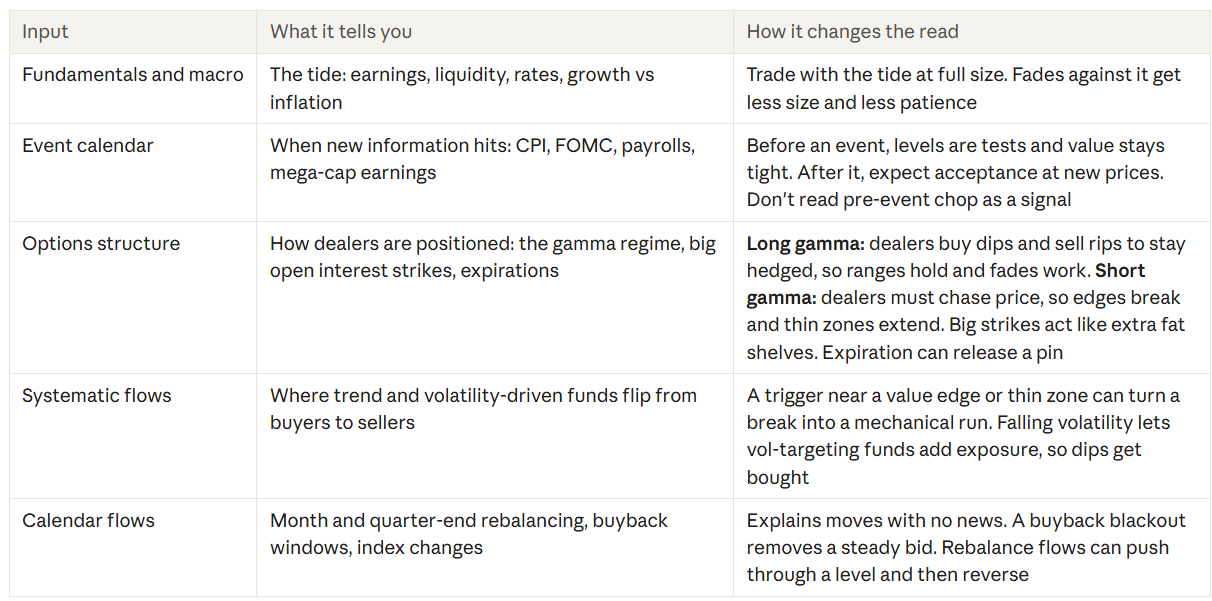
The best trades show up when 3 or 4 of these line up at one price. A value area high that sits at a big call strike, above a flattening VWAP, in a long gamma tape, the day before CPI, is a very different level from the same price with nothing behind it.
5 reads on the ES tape
Every read below asks the same question at a different spot on the map: is the market accepting this price, or rejecting it? Each one comes with the context where it works best, because the same pattern means different things in different regimes.
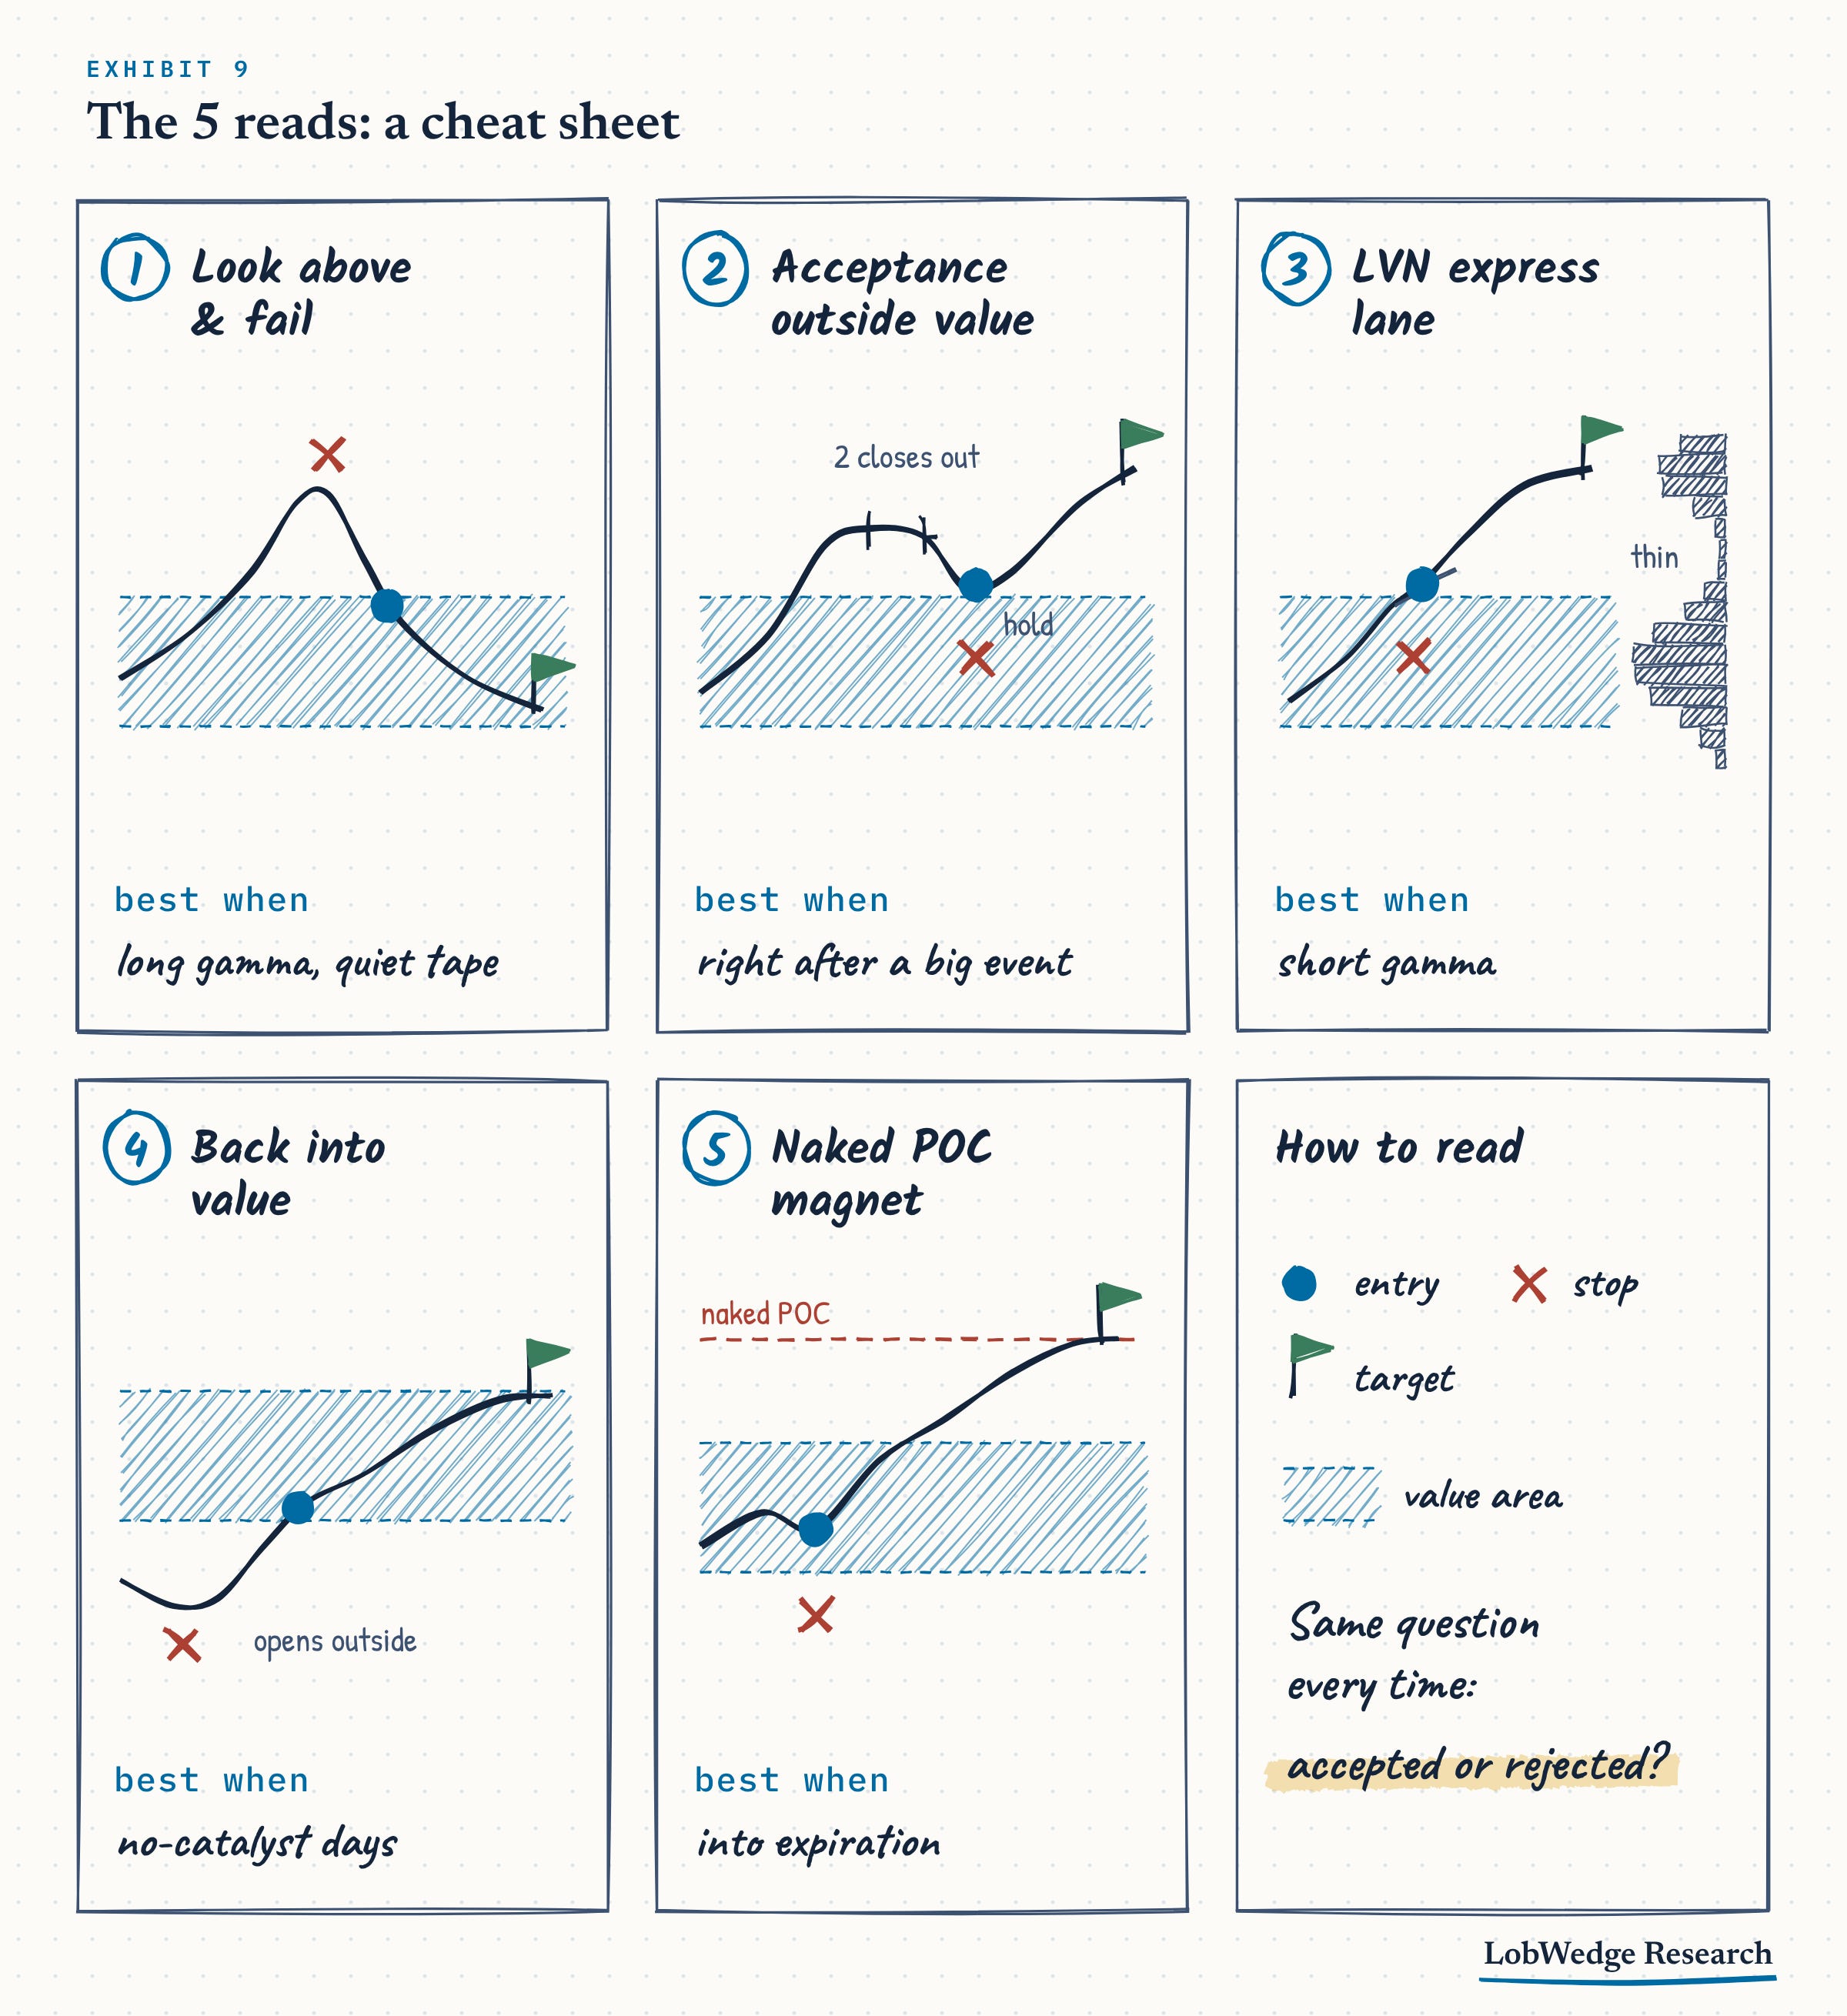
1. Look above and fail
What you see: Price pokes above the value area high or yesterday’s high, on light volume, and the next bars close back inside value. Often it’s stretched to the upper VWAP band as it does it.
What it means: The market tested a higher price and nobody new wanted to pay it. The algos that sell at the reference point sold, and no aggressive buyer stepped in. Rejected.
The trade: Short on the first close back inside value. Stop a few ticks above the poke high. First target VWAP or the POC, second target the far side of value. The same trade works upside down for a failed look below value.
Best when: Long gamma, quiet tape, no big event until after the close.
2. Acceptance outside value
What you see: Price breaks out of value and stays there. Volume expands on the break, VWAP turns up behind it, and new trading starts building above the old value high.
What it means: The market found a new fair price. The old range is history.
The trade: Don’t chase the first push. Wait for a pullback to the old value high or to VWAP. If it holds on lighter volume, get long. Stop back inside value. Target the next fat shelf or naked POC above. A simple acceptance test: 2 straight 30-minute closes outside value. One is a probe. Two is a decision.
Best when: Right after a major event, or when dealers are short gamma and the break agrees with the flows.
3. The thin-zone express lane
What you see: Price breaks into a low-volume node with a pickup in volume.
What it means: There are very few resting orders in there, so price tends to travel straight to the next fat shelf.
The trade: Enter on the break into the thin zone. Target the far edge, where the next fat shelf starts. Stop just back on the other side. These are quick trades. Take them, bank them, move on.
Best when: Short gamma, or a systematic trigger sits right at the edge of the zone. In long gamma these moves often stall halfway as dealer hedging leans against them.
4. Back into value
What you see: ES opens outside yesterday’s value area, then trades back inside and holds there for at least a full 30-minute period.
What it means: The move outside got rejected, and the market is going back to the old agreement.
The trade: Trade toward the far side of value, with VWAP and the POC as checkpoints. Stop outside the edge it came back through. It works best on quiet days and gets run over on trend days.
Best when: No-catalyst days, long gamma, open interest clustered near the POC.
5. Naked POC magnet
What you see: An old POC sitting untouched near current price.
What it means: It was the fairest price of an earlier session and the market hasn’t been back. Those prices tend to get revisited.
The trade: Use it as a target, not an entry. If you’re already in a trade heading that way, it’s a logical place to take profits. If price tags it with big effort and little result, the move is probably done.
Best when: Heading into options expiration, or when the naked POC lines up with a big strike. Then you have 2 magnets at one price.
Putting it on a trade
A good read is worth nothing if the trade structure can blow you up. Here’s how we turn a read into a trade where the worst case is known before you click.
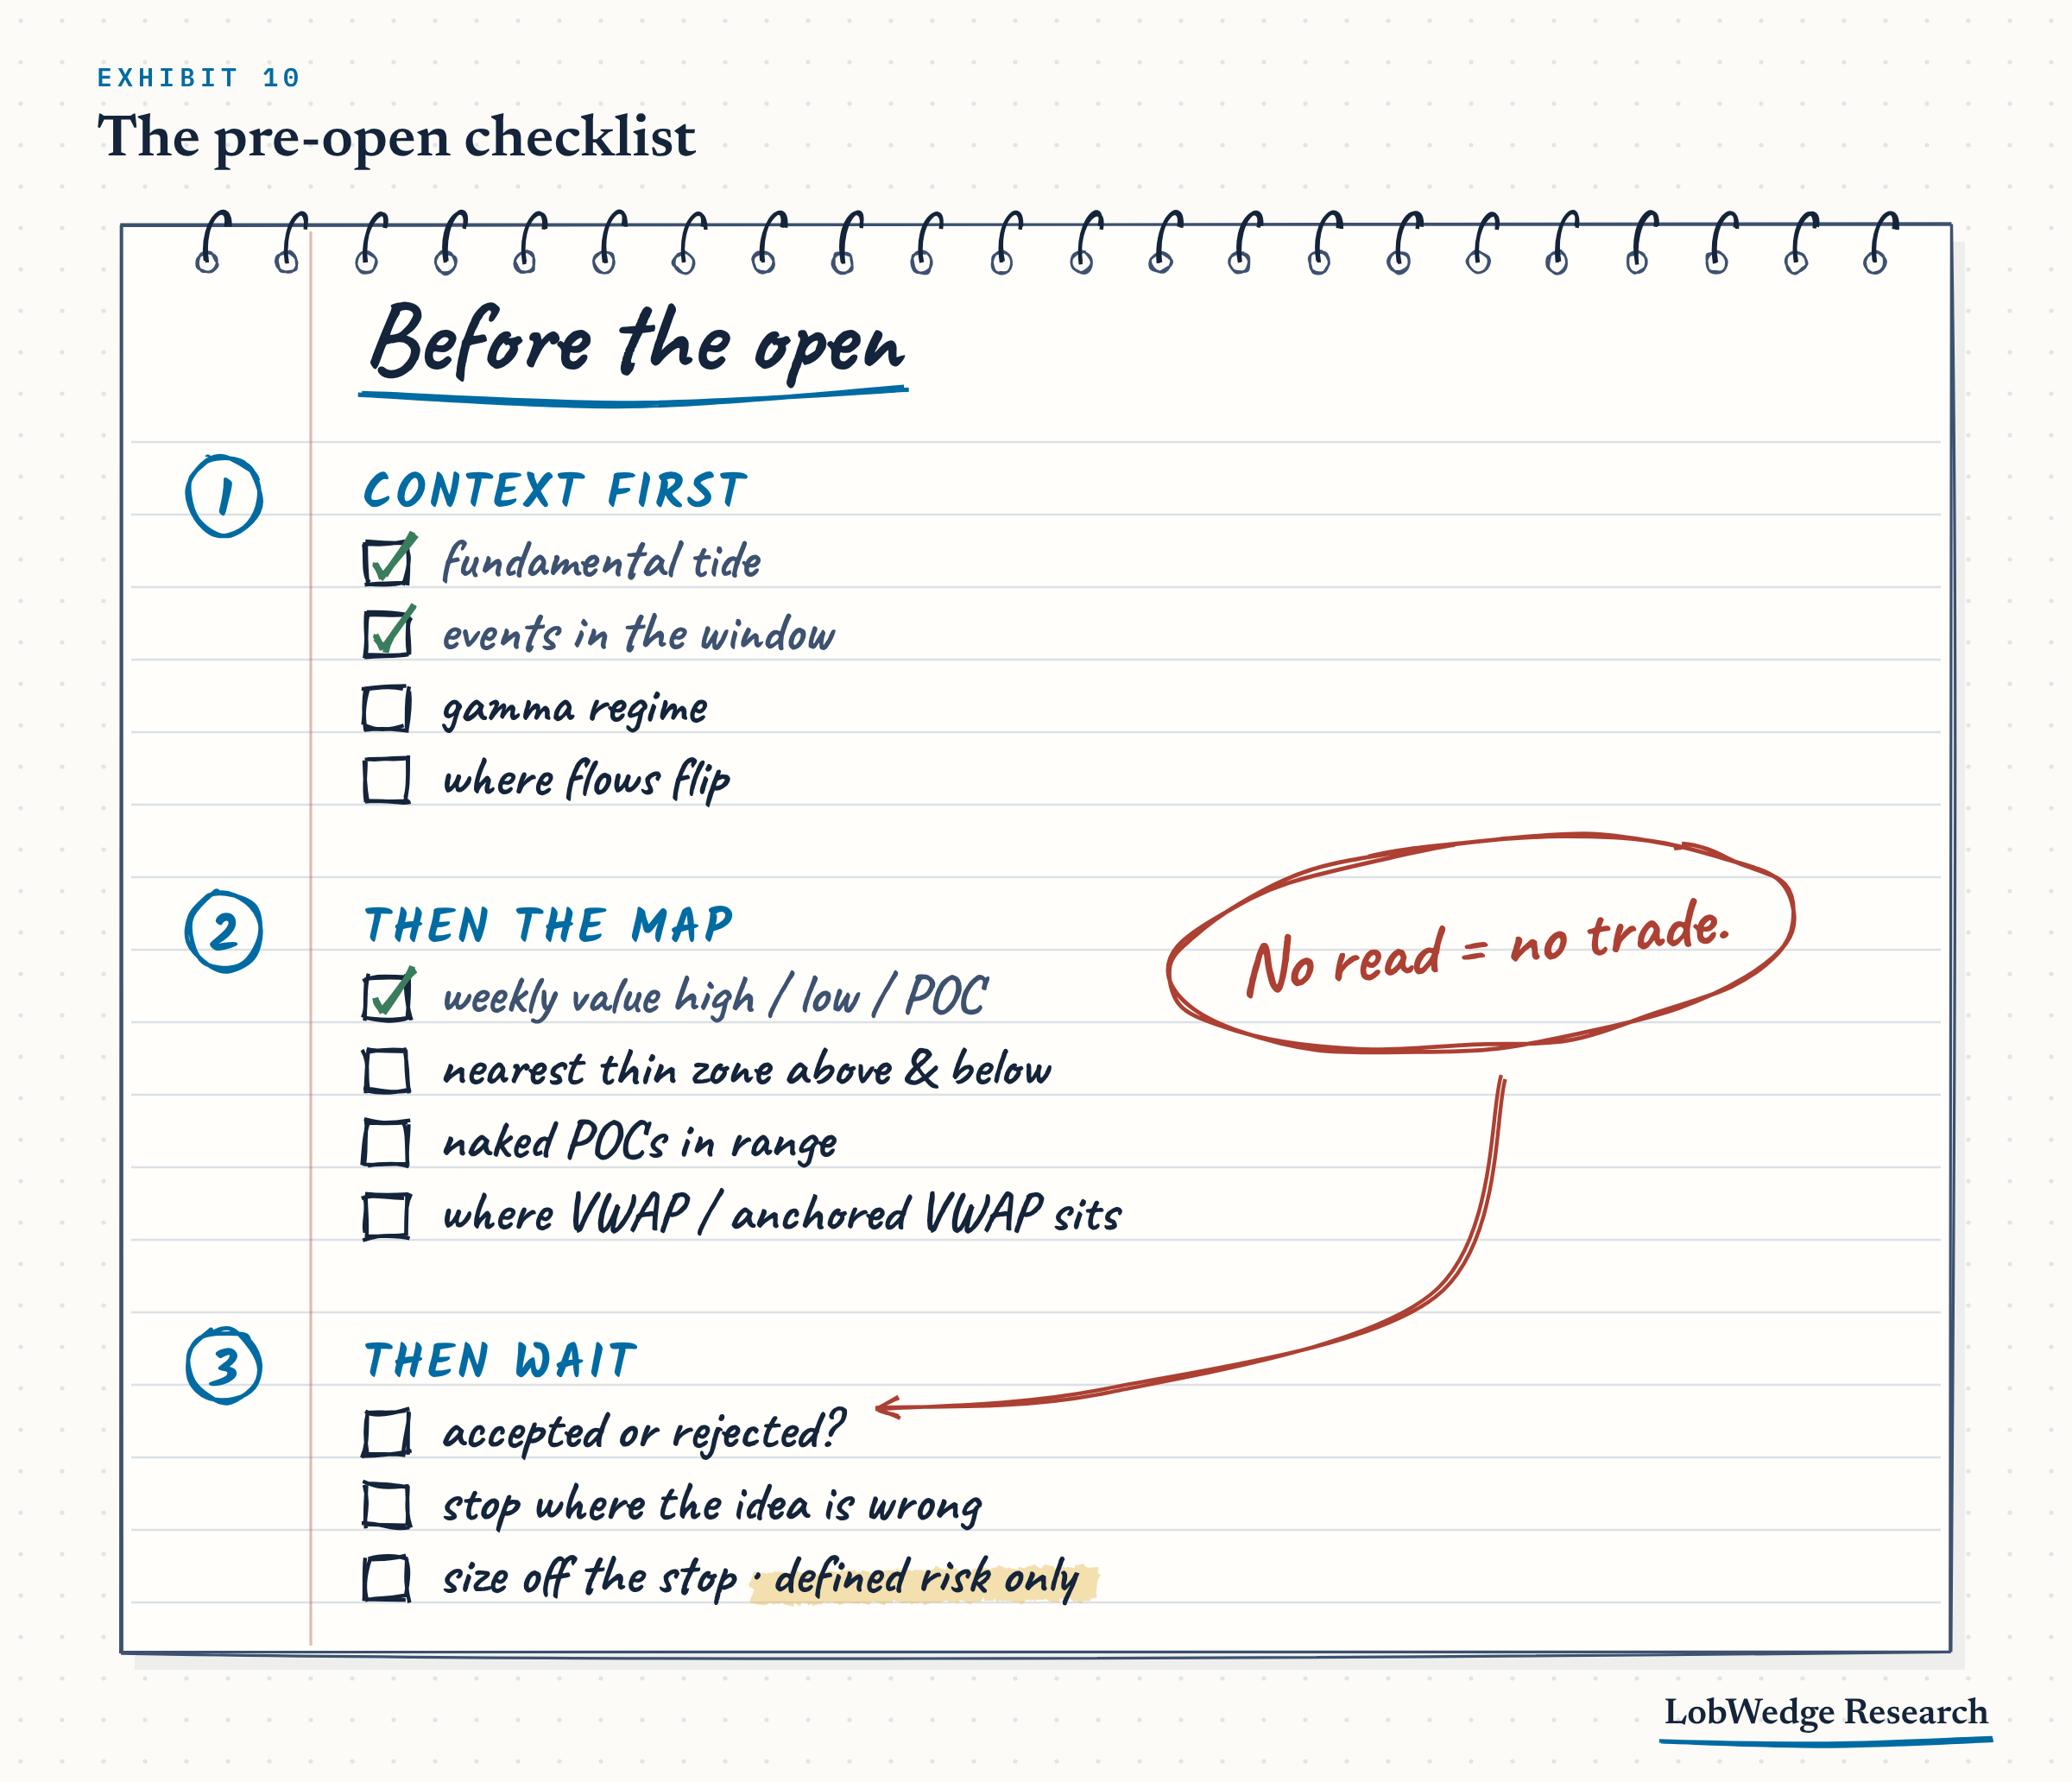
Context first. Know the fundamental tide, which events land inside your holding window, the gamma regime, and where systematic flows switch. That tells you which of the 5 reads to expect today.
Then the map. Mark the weekly value area high, low and POC, the nearest thin zone above and below, any naked POCs in range, and where VWAP and any important anchored VWAP sit. If you can’t draw it in 5 minutes, it’s too cluttered.
Then wait. Let the first hour show you whether price is accepting or rejecting the edges. The market picks the read, not you.
Stop where the idea is wrong, not where the pain is. Every read has a natural invalidation: back inside value, back through the thin zone, above the failed poke, back under VWAP. If price gets there, the auction told you something new.
Size off the stop. Decide what you’ll risk first, then divide by the distance to the stop. A wide structural stop means a smaller position.
Defined risk only. On the options side, a debit spread aimed at the next fat shelf or naked POC fits these reads well. The max loss is what you paid, and the target is a real place on the map. Treat it as a 0-5 day trade and manage the exit at your level. No naked short options. A read can be right and still get run over by a headline.
Learning moment: patience in a machine market
The hardest part isn’t spotting the patterns. It’s waiting for the answer.
In a market run by algos, the first move through a level is often a machine probing for orders, not a decision. Breakouts on light volume exist because people buy the first print without checking turnout. Waiting 1 or 2 bars for acceptance is most of the edge, and it costs you nothing except the feeling of missing out.
A few habits that help:
Say the read out loud before you trade. “Price is above value on 2x volume, holding above VWAP. That’s acceptance.” If you can’t finish the sentence, you don’t have a trade.
Grade the read, not the P&L. A correct read that got stopped is a good trade. A lucky win on a bad read is a bad one.
Stop trading the middle. Most damage happens inside value, around the POC and VWAP on a range day, where nothing gets decided. The edges are where the information is.
This is also where the work is heading. Our trader AI brain in the backend already runs these checks at every level: is volume expanding, is price holding outside value, which side of VWAP is it on, is it travelling a thin zone, and do the gamma regime, the event calendar and the flows agree. Machines are good at asking the same question 1,000 times without getting bored or scared. Your job shifts to understanding why the read works, so you know when to trust it and when the context says stand aside.
Pulling it together: how we build the week
Go back to that breakout above the prior high. Most of what would have kept me out was known before the open: the thin zone above, long gamma, CPI the next morning. The light volume and the stretch above VWAP showed up in real time. The problem wasn’t missing information. It was having it scattered across 5 screens and putting it together too late.
That’s the job LobWedge Research does every week. We take all of it and turn it into one plan you can trade:
The tide. Where fundamentals, liquidity and the macro mix are pushing, and whether price agrees.
The calendar. Which events land inside the week, and what each one is really a vote on.
The positioning. The options structure, the gamma regime, and where systematic flows are likely to switch on or off.
The map. Our ES levels for the week, built from where the market has actually done business and graded against what happened.
The scenarios. 3 paths for the week, weighted off how similar setups have played out historically, not off a hunch.
The ideas. Defined-risk trades for index, single names and options, each with an entry, a stop, a target and the thing that would kill it.
Every Sunday you get the full plan. On Wednesday we re-mark the map as the week unfolds. Then we grade it on the tape.
A real week, start to finish
Here is Week 40, the week of Sep 28, replayed on the levels we actually published. Nothing redrawn after the fact.
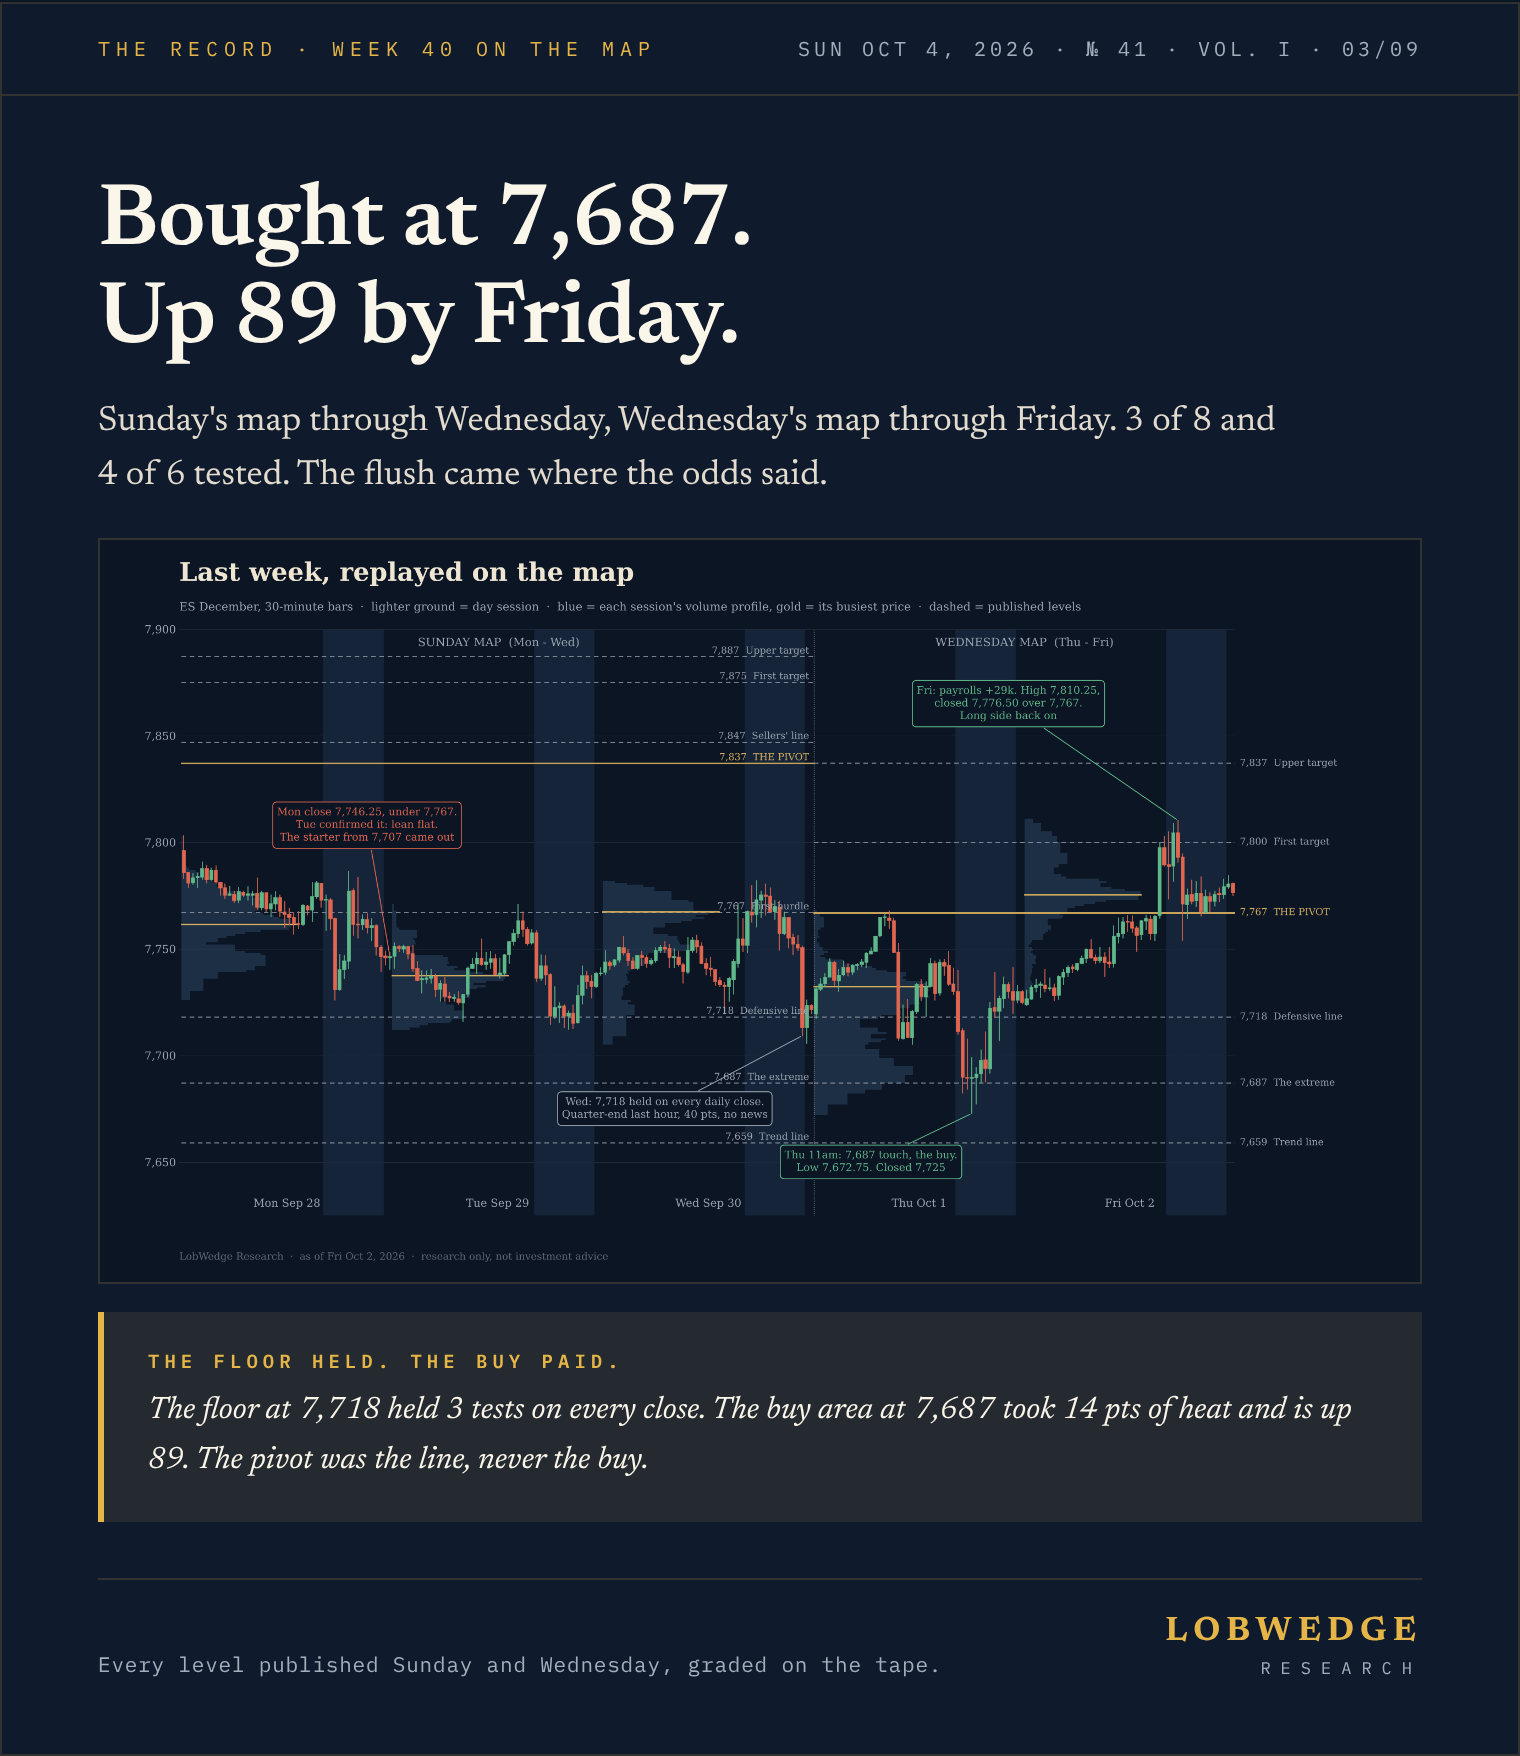
The whole post is in this one chart:
Monday, a miss. ES closed 7,746.25, under the 7,767 pivot. Tuesday confirmed it, and our starter long from 7,707 came out. We said so in the next note.
Wednesday, calendar flow. Quarter-end rebalancing pushed price 40 pts in the last hour with no news. The 7,718 defensive line held on every daily close anyway.
Thursday, the buy. Price touched the 7,687 buy area at 11 a.m. The low was 7,672.75, so 14 pts of heat, and it closed 7,725.
Friday, the event. Payrolls came in at +29k. ES ran to 7,810.25 and closed 7,776.50, back over the pivot. The position from 7,687 was up 89 pts.
On Sunday’s map, 3 of 8 levels traded, and on Wednesday’s, 4 of 6. Not every level gets tested, and not every trade works. The point is that the plan said where we would buy, where we were wrong, and why, before the week started.
How we keep ourselves honest
Anyone can post a winning chart after the fact. Here are the rules we hold ourselves to instead:
Every published level gets graded against the regular-session tape: touched or not, held or not.
No backfill. Scoring started Aug 7, 2026. We don’t rebuild an older record, because a history we could pick the inputs for is worth nothing.
Misses come first. The scorecard leads with what didn’t work, like the Monday stop above.
No hit rate until the sample earns it. We publish a reaction rate only after 40+ touches, with its error band and compared against a coin flip. If it isn’t better than 50/50, we’ll say so.
Who builds this
I’ve spent my career on both sides of the screen. I trade the same plan I publish. The backend runs on the systems described in this post, so the work gets done the same way every week, not when I feel like it.
Start with the free tier
If this post was useful, subscribe free and you’ll get more like it. When you want the live version, the Sunday plan, the Wednesday update and the levels graded every week, upgrade to paid. Read a few weeks, check the scorecard, and decide for yourself.