

A while back I wrote about how Livermore would trade ES today. That piece was about execution. This one is about how I build the map.
What This Is
LobWedge Research publishes structured analysis for S&P 500 traders. The idea is simple: instead of predicting where the market is going, identify where it’s likely to react and what to do when it gets there.
More planning, less reacting. That’s the whole game.
The plan exists so you’re not chasing highs and selling lows. It gives you a framework to think strategically instead of scrambling when price moves.
My approach comes from years of reading the tape. Watching how price behaves at certain levels. Noticing patterns in the flow. With modern tools, we can quantify those observations and structure them into something repeatable.
The Instruments
There are several ways to trade the S&P 500. Each has different characteristics:
ES (E-mini S&P 500 futures). The main contract. Each point is $50. Trades nearly 24 hours. This is what institutions use. Futures get favorable tax treatment: 60% of gains taxed as long-term, 40% as short-term, regardless of holding period. That blended rate adds up.
MES (Micro E-mini). Same as ES, 1/10th the size. Each point is $5. Same tax treatment. Good for smaller accounts or sizing in more precisely.
SPX (S&P 500 Index options). Options on the cash index. European-style, so they only exercise at expiration and settle in cash. No shares change hands. Also gets the 60/40 tax treatment. Each point is $100.
XSP (Mini-SPX). Same as SPX, 1/10th the size. Each point is $10. Same settlement, same tax advantages. Better for smaller accounts.
SPY (S&P 500 ETF options). Options on the ETF. American-style, settles in shares. No special tax treatment. More liquid than SPX/XSP with tighter spreads, but you give up the tax edge.
The levels in our plan apply to all of these. ES and SPX move together tick for tick. Pick the instrument that fits your account and tax situation.
0DTE
0DTE means zero days to expiration. Options that expire the same day you trade them.
SPX now has expirations every day of the week. That changed everything. You can express a view or sell premium with positions that last hours instead of weeks. The leverage is enormous. A few points can double or wipe out a position.
For 0DTE, you need to know where support and resistance are right now. Not next week. Today. That’s what the daily levels provide. Where might buyers step in? Where might sellers cap a rally? Where are the options walls creating hedging flows?
Selling spreads? You want short strikes beyond levels likely to hold. Buying directional? You want entries where the odds favor a reaction.
The risk is obvious. Fast moves, total loss possible, no time to recover. A plan before the open is the difference between trading and gambling.
Options Flexibility
SPX and XSP let you structure a position for any market.
High conviction level? A simple call or put. Directional, defined risk, straightforward.
Range-bound environment? Sell a strangle. Put on an iron condor. Collect premium while the market chops.
Directional lean but want to reduce cost? Spreads define risk and reward precisely. Verticals, butterflies, calendars. Each fits a different setup.
The plan tells you the levels and likely behavior. Options let you tailor the trade. Trending? One structure. Range? Another. High conviction? Maybe naked. Lower conviction? Spread it off. Lots of flexibility once you know where the edges are.
How This Differs
There’s no shortage of market analysis. Technical charts, options flow services, gamma maps, weekly outlooks from banks and funds. So what’s different?
This is my experience turned into a system. I’ve been trading and posting levels as @vader7x for years. The heuristics I’ve developed, the patterns I’ve learned to recognize, the mistakes I’ve made and corrected. All of that is now encoded into a framework that surfaces actionable ideas. It lets me focus on the important decisions and do less of the dumb things. A systematic approach built from discretionary experience.
Technical analysis gives you lines without context. Support here, resistance there. But which levels matter this week? What changes if news hits? A level that held five times in quiet trading might mean nothing after a gap on tariffs. We grade conviction based on structure and context, not just where price bounced before.
Options flow tools show positioning but not what to do with it. Great, you can see where the puts and calls are stacked. How does that interact with volume structure? Where does hedging flow reinforce a level versus conflict with it? We synthesize options and price structure to find where they align.
Gamma maps update constantly, which sounds useful until you’re reacting to every tick. The levels shift, the narrative shifts, you end up chasing data instead of trading a plan. We set levels Sunday. They don’t move because a model recalculated midday. You know your prices in advance.
Institutional outlooks read like CYA documents. On one hand this, on the other hand that. Nuance without clarity. We publish specific levels, scenarios, and triggers. If X happens, do Y. If Z happens, do W. You can disagree, but at least you know the plan.
The goal isn’t to replace everything you look at. It’s to be the source that tells you what to do and where.
The Approach
We look at structure. Where did volume concentrate? Those prices become magnets. Where did price move fast with little volume? Those areas become barriers.
We look at options positioning. Where are the large puts and calls? Those create hedging flows that support or cap price. The expected move tells us how far the market thinks it can travel.
Combining volume structure with options data gives us a map of high probability reaction zones. Not predictions. Locations where the odds favor a response.
But a map isn’t a trade.
News happens throughout the week. Tariffs, earnings, data. Some events expand the range. Others set up reversion. The opportunity comes from lining up the map with what’s actually unfolding.
The Philosophy
I’m not trying to call tops. I’ve been through that phase. Years of trying to nail the turn, catch the reversal, be the one who saw it coming. It’s a tough game. Stressful. Even when you’re right, timing has to be perfect or you get stopped out before the move happens.
What I’ve found more rewarding is riding the trend. Buying dips in strong markets. Getting on the train at good prices instead of trying to predict when it stops.
That doesn’t mean always long and hoping. The plan identifies tactical fade zones where a pullback is likely even within an uptrend. Taking those short trades while holding core longs generates extra alpha. More importantly, it helps weather storms. When the market pulls back, tactical shorts offset drawdown on the long book. You’re actively managing instead of hoping.
This means you don’t need perfect timing. Longs work over time while short-term trades smooth the ride. It’s a more forgiving way to trade.
Maybe we get a few real dip opportunities a year. Be prepared for those. But most of the time, money is made staying with the direction, not fighting it.
The plan can also identify hedge zones. Stretched to the upper expected move with momentum fading? Not a sell signal, but maybe a spot for downside protection or tighter stops. The plan gives you the levels. What you do with them is up to you.
Day to day, intraday movement provides plenty of opportunities. They come from levels on the plan, directional bias, and all the hedging and algo activity in the range. Market makers adjusting delta. Funds rebalancing. CTAs responding to momentum. That flow creates predictable behavior at certain prices.
We look for 3:1 reward-to-risk when we can get it. Risk 20 to make 60. That math lets you be wrong more often than right and still come out ahead. But we take what the market gives. Some weeks the edge is obvious. Others we wait. Not every day has a trade. That’s fine.
Volatility: Defense and Offense
The plan works best when we have a read on volatility. When the range behaves, when price respects structure, when levels hold or break cleanly. Most weeks are like this.
But sometimes things unhinge. A headline hits. Vol spikes. Price blows through multiple levels in a session. Out-of-value moves, risk on or risk off. The market’s character changes.
When this happens, risk management comes first. Reduce size, widen stops, sit out until things settle.
But vol expansion isn’t just defense. It’s also opportunity.
When ranges compress, when IV is low, when the expected move is tight, that’s often the setup before a big move. The plan flags these conditions. Low IV percentile means options are pricing calm. Calm doesn’t last forever.
Position at the right level when vol expands and you ride a much bigger move than options were pricing. The same framework that says get small when chaotic also says be ready when coiled.
Knowing which environment you’re in is half the battle.
The System
Three pieces:
Weekly Plan (Sunday). Sets the map. Key levels ranked by conviction. Two or three scenarios with triggers and targets. Expected move from options. Major catalysts. Context for the week.
Daily Levels. More granular. Today’s edges within weekly structure. Directional bias. Where intraday flows might create opportunity. This is where active traders and 0DTE players find entries.
Mid-Week Update (Wednesday). Markets evolve. Which levels held? Which broke? Did scenarios confirm or invalidate? How much range is used? Keeps the map current for Thursday and Friday.
Simplicity by Design
The output is clean and readable. A handful of levels. A couple scenarios. Clear triggers and targets.
Heavy lifting happens on the back end. A rules engine takes volume profile, options positioning, expected moves, catalysts, prior price action. It weights and filters, then surfaces what matters.
The goal is something digestible that leads to tradeable ideas. Not another wall of charts adding to the noise. Markets generate endless information. Most of it confuses more than helps.
You shouldn’t have to weed through everything yourself.
An Example
Sunday
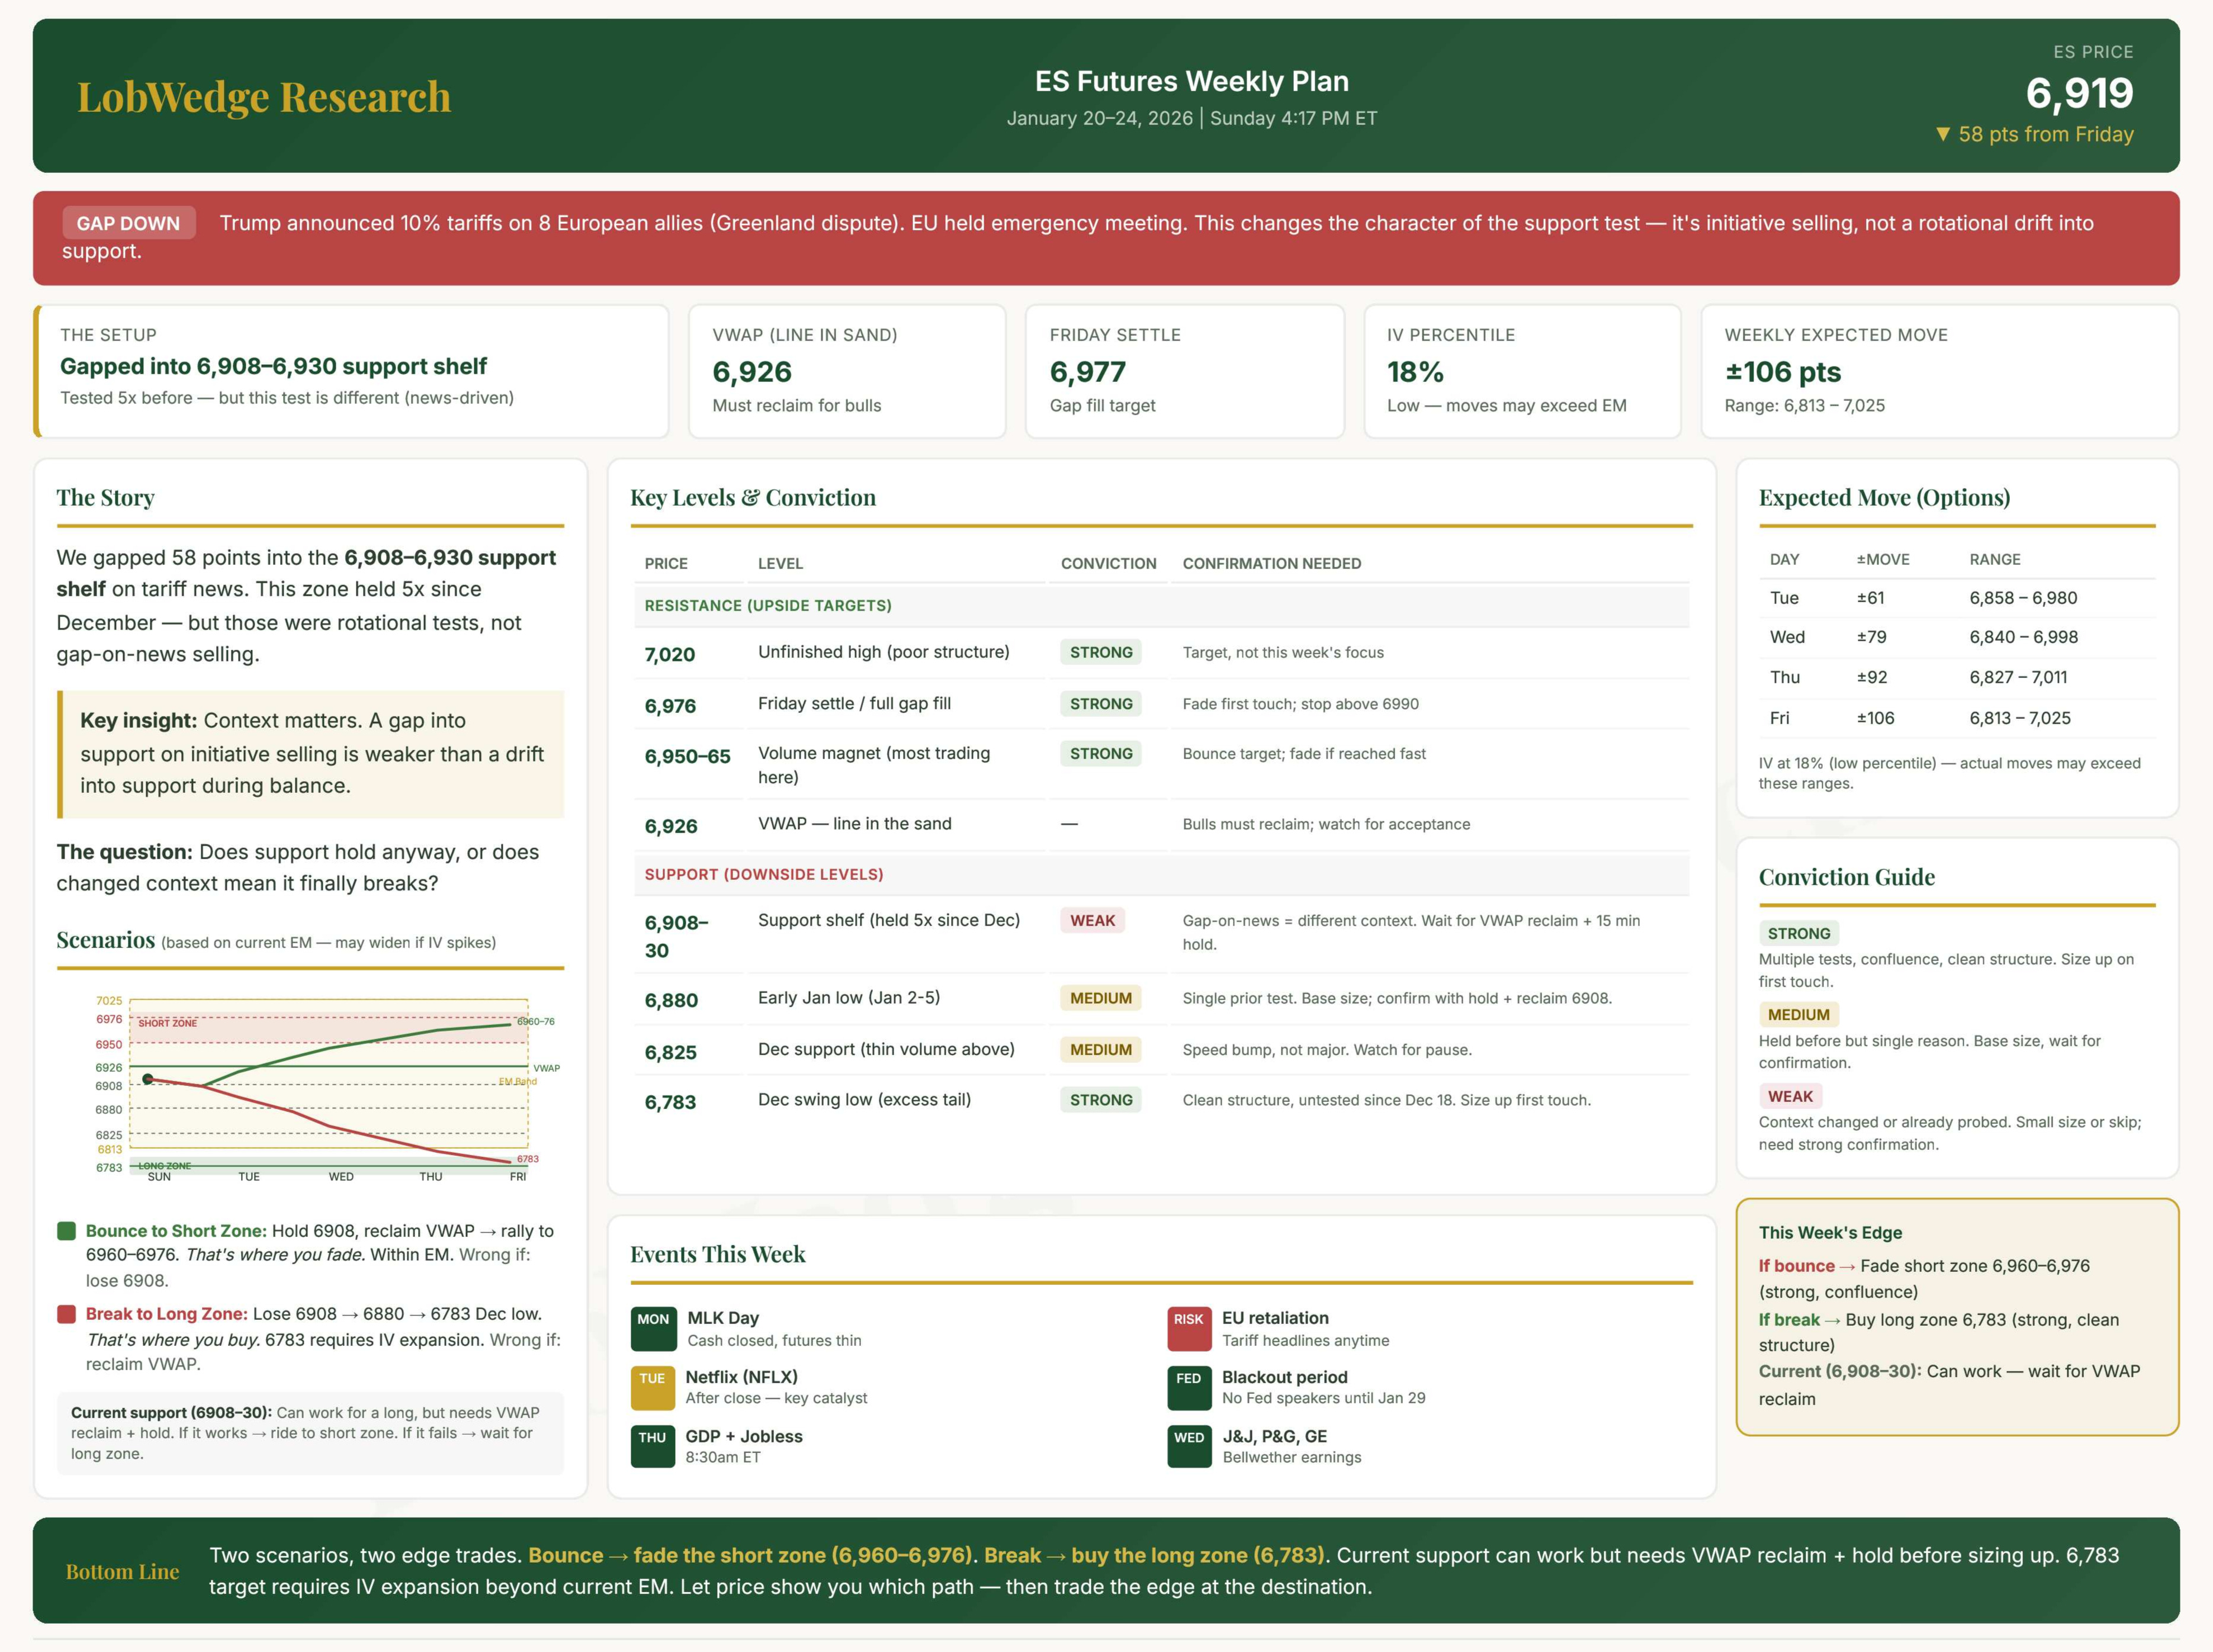
ES gapped down 57 points on tariff headlines. Simple question: does support at 6,908-6,930 hold, or do we break toward the December low at 6,783?
The plan mapped both paths. Bounce: hold support, reclaim VWAP, target gap fill at 6,976. Break: lose support, target 6,783.
IV was low (18th percentile). Options priced a tight range. But with tariffs in play, actual moves could exceed expectations.
example (improving weekly!):
Early Week
Support didn’t hold. Price dropped to 6,814, almost exactly the bottom of the expected move. Then bounced hard. 96 points off the low.
This is a failed breakdown. Price undercuts support, flushes weak hands, reverses sharply. One of the most bullish signals in the playbook.
Wednesday
Mid-week update killed the break scenario. Fair value shifted. The 6,814 low became the new floor.
New edge trades: buy dips toward 6,880-6,895, fade rallies toward gap fill at 6,960-6,977.
Friday
Price rallied to 6,969, testing gap fill. Support that was weak Sunday had proven itself and got upgraded. 73% of weekly range used.
The Point
Sunday didn’t predict the drop to 6,814. But the level was mapped. When price hit and bounced, the framework identified the failed breakdown. Mid-week adjusted the scenarios. By Friday, buy zones and fade zones were clear.
Map the levels. Watch how the market responds. Adjust. Not predicting every move. Just prepared for what matters.
Why It Works
Markets have memory. Prices where significant volume traded become reference points. Participants remember their entries. When price returns, behavior clusters. Some add to positions. Some defend. Some take profit. That clustering creates predictable reactions.
Options positioning adds another layer. Large open interest creates hedging flows as price approaches. Dealers adjust delta, which can accelerate or dampen moves at certain prices.
None of this guarantees outcomes. But it shifts the odds. Trade at random prices and you’re guessing. Trade where structure and positioning align, and you have an edge.
Who Uses This
Futures traders (ES, MES). Weekly plan for context, daily levels for entries. Framework provides structure; execution stays discretionary.
Options traders (SPX, XSP, SPY, 0DTE). Same levels. Knowing support and resistance helps with strike selection, spread placement, timing. When the plan says 6,960 is resistance, that informs where to sell call spreads or take profits on long deltas.
Equity investors. The S&P is the market. When it finds support, most stocks do too. I use the plan to time entries on strong names I want to own. At major support, I’m looking at my watchlist. Stretched to resistance, I might trim or hedge.
Same map, different uses. The levels don’t change. What you do with them does.
What We Publish
Sunday. Weekly plan: levels, scenarios, expected move, catalysts.
Daily. Session levels, bias, where the edges are.
Wednesday. Mid-week update with adjustments for Thursday and Friday.
The weekly plan is the map. Daily levels show where to act. Mid-week keeps it honest.
Preparation over prediction.
Thanks for Reading
This is a work in progress. The framework evolves as markets change and tools improve. If something resonates or something’s unclear, I’d love to hear it. Always open to feedback.
Appreciate the time.
LobWedge Research
Excellent write up!
Planning 🙏