

This one's free this week. A note on how it's made: most of this post comes out of the agentic research platform we're building, and it changes every week. Kind of like a caddy! It helps you play better…but doesnt swing for you. not yet. The goal is end to end, research through execution. The reason is simple: do the market research faster, get better at what we do, get the time back from automation, and ideally make money doing it. If you have ideas, or want to build on some of this together, reply to this email. Or just subsrcribe. Thanks for reading.
Three things before Monday.
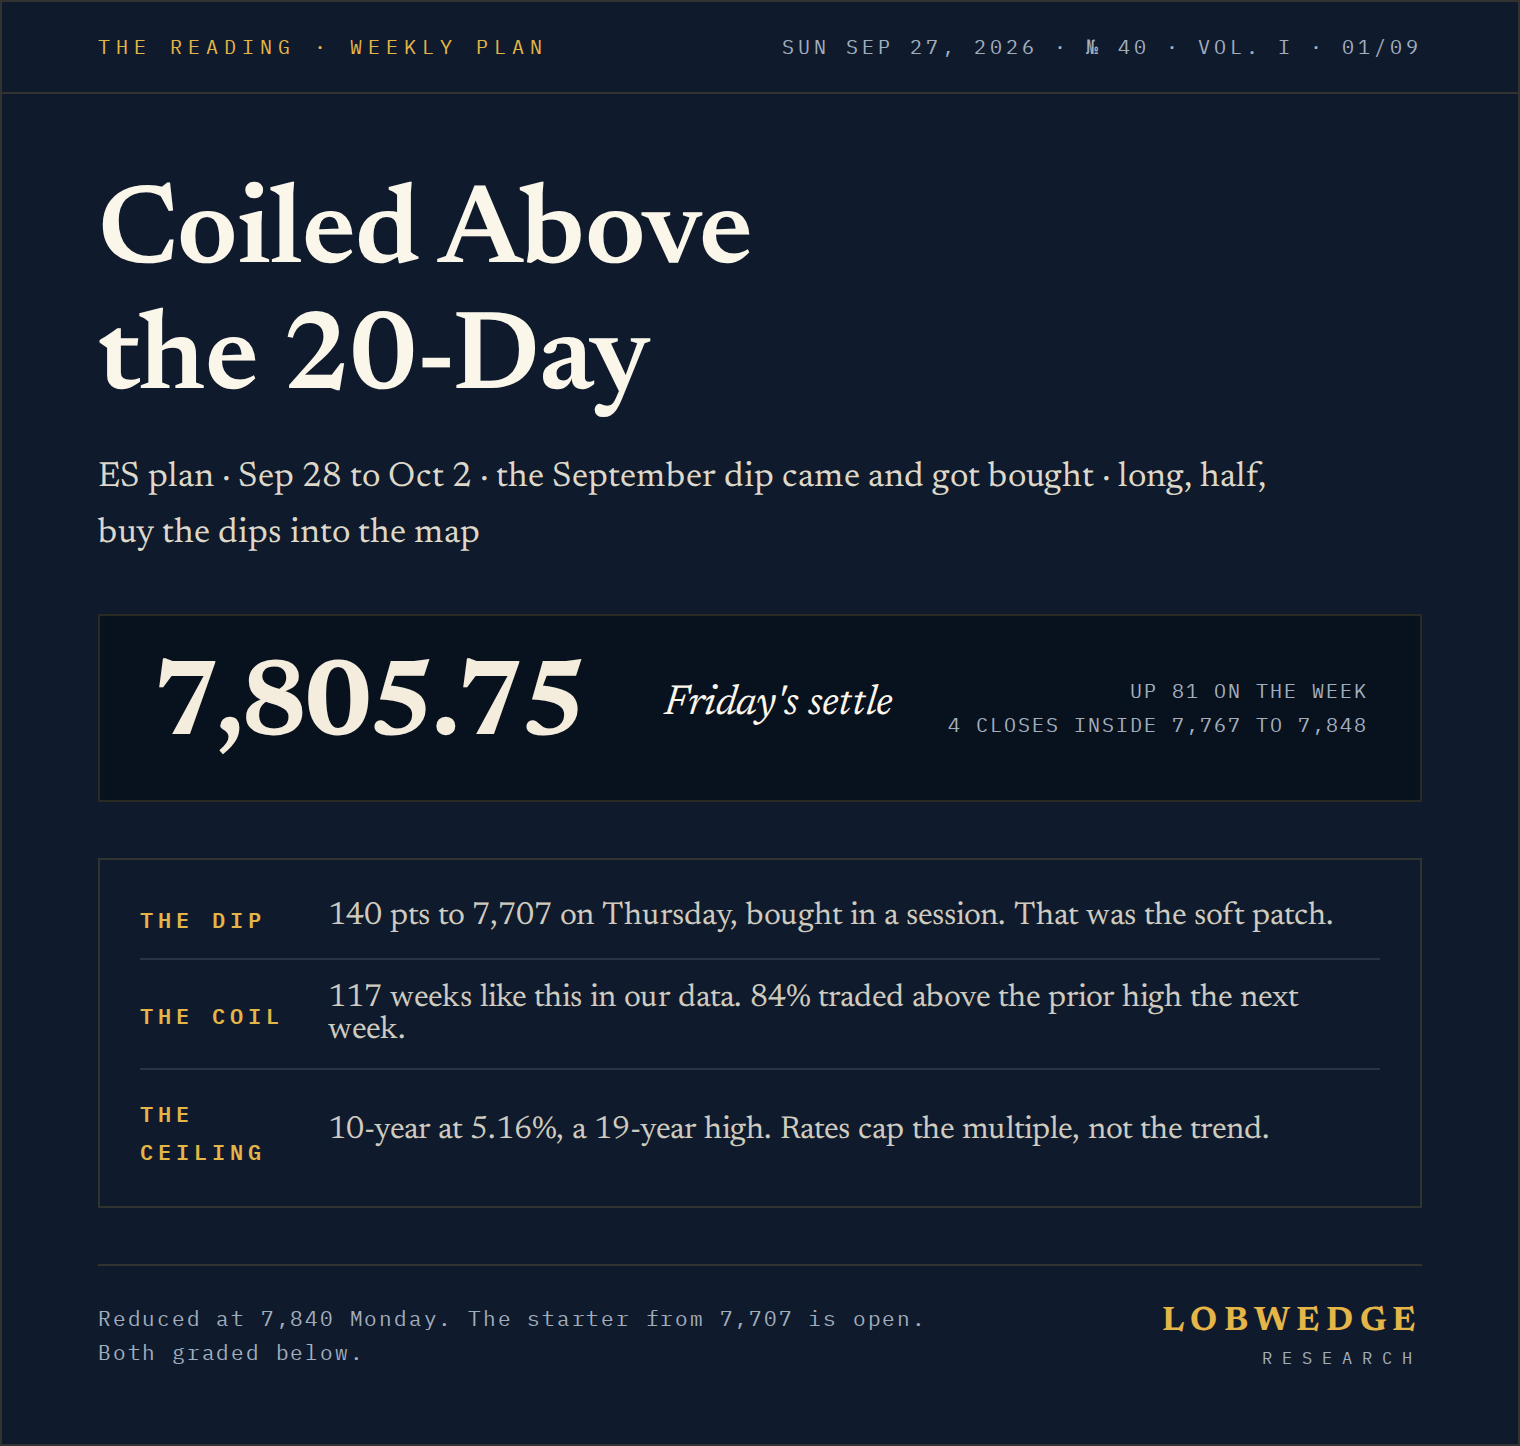
The dip we planned for showed up and it was small. ES fell 140 pts from Tuesday’s high to 7,707 on Thursday, landed on the one mid-September level never revisited, and closed the week at 7,805.75, up 81. That’s the whole soft patch so far: 2 sessions, bought. Price sits 62 pts over its 20-day and 80 over its 50-day, with the last 4 closes inside 7,767 to 7,848.
Rates are the ceiling. The 10-year closed 5.16%, a 19-year high, with better than 70% odds of another hike priced for October. The index rallied anyway, on oil. Underneath, 3 stocks in 10 hold their short-term trend and the equal-weight index fell on a week the cap-weighted one rose 1.3%. The leaders again.
We’ve seen this shape 117 times in our own 10 years of ES: a week that tests the 20-day, holds it, and closes in the top half of its range. The next week traded above the prior week’s high 84% of the time, against 64% for any week, and closed under the 20-day 10%, against 33%. The coil usually resolves up. It usually dips first, about 0.8%, which is where 7,767 comes in.
The plan: long, half size, the starter from 7,707 still on. Buy dips into 7,767, wait for 7,837 to close, take 7,875 and 7,887 if it does. One close takes the trade away; it’s below.
Last week, on the map
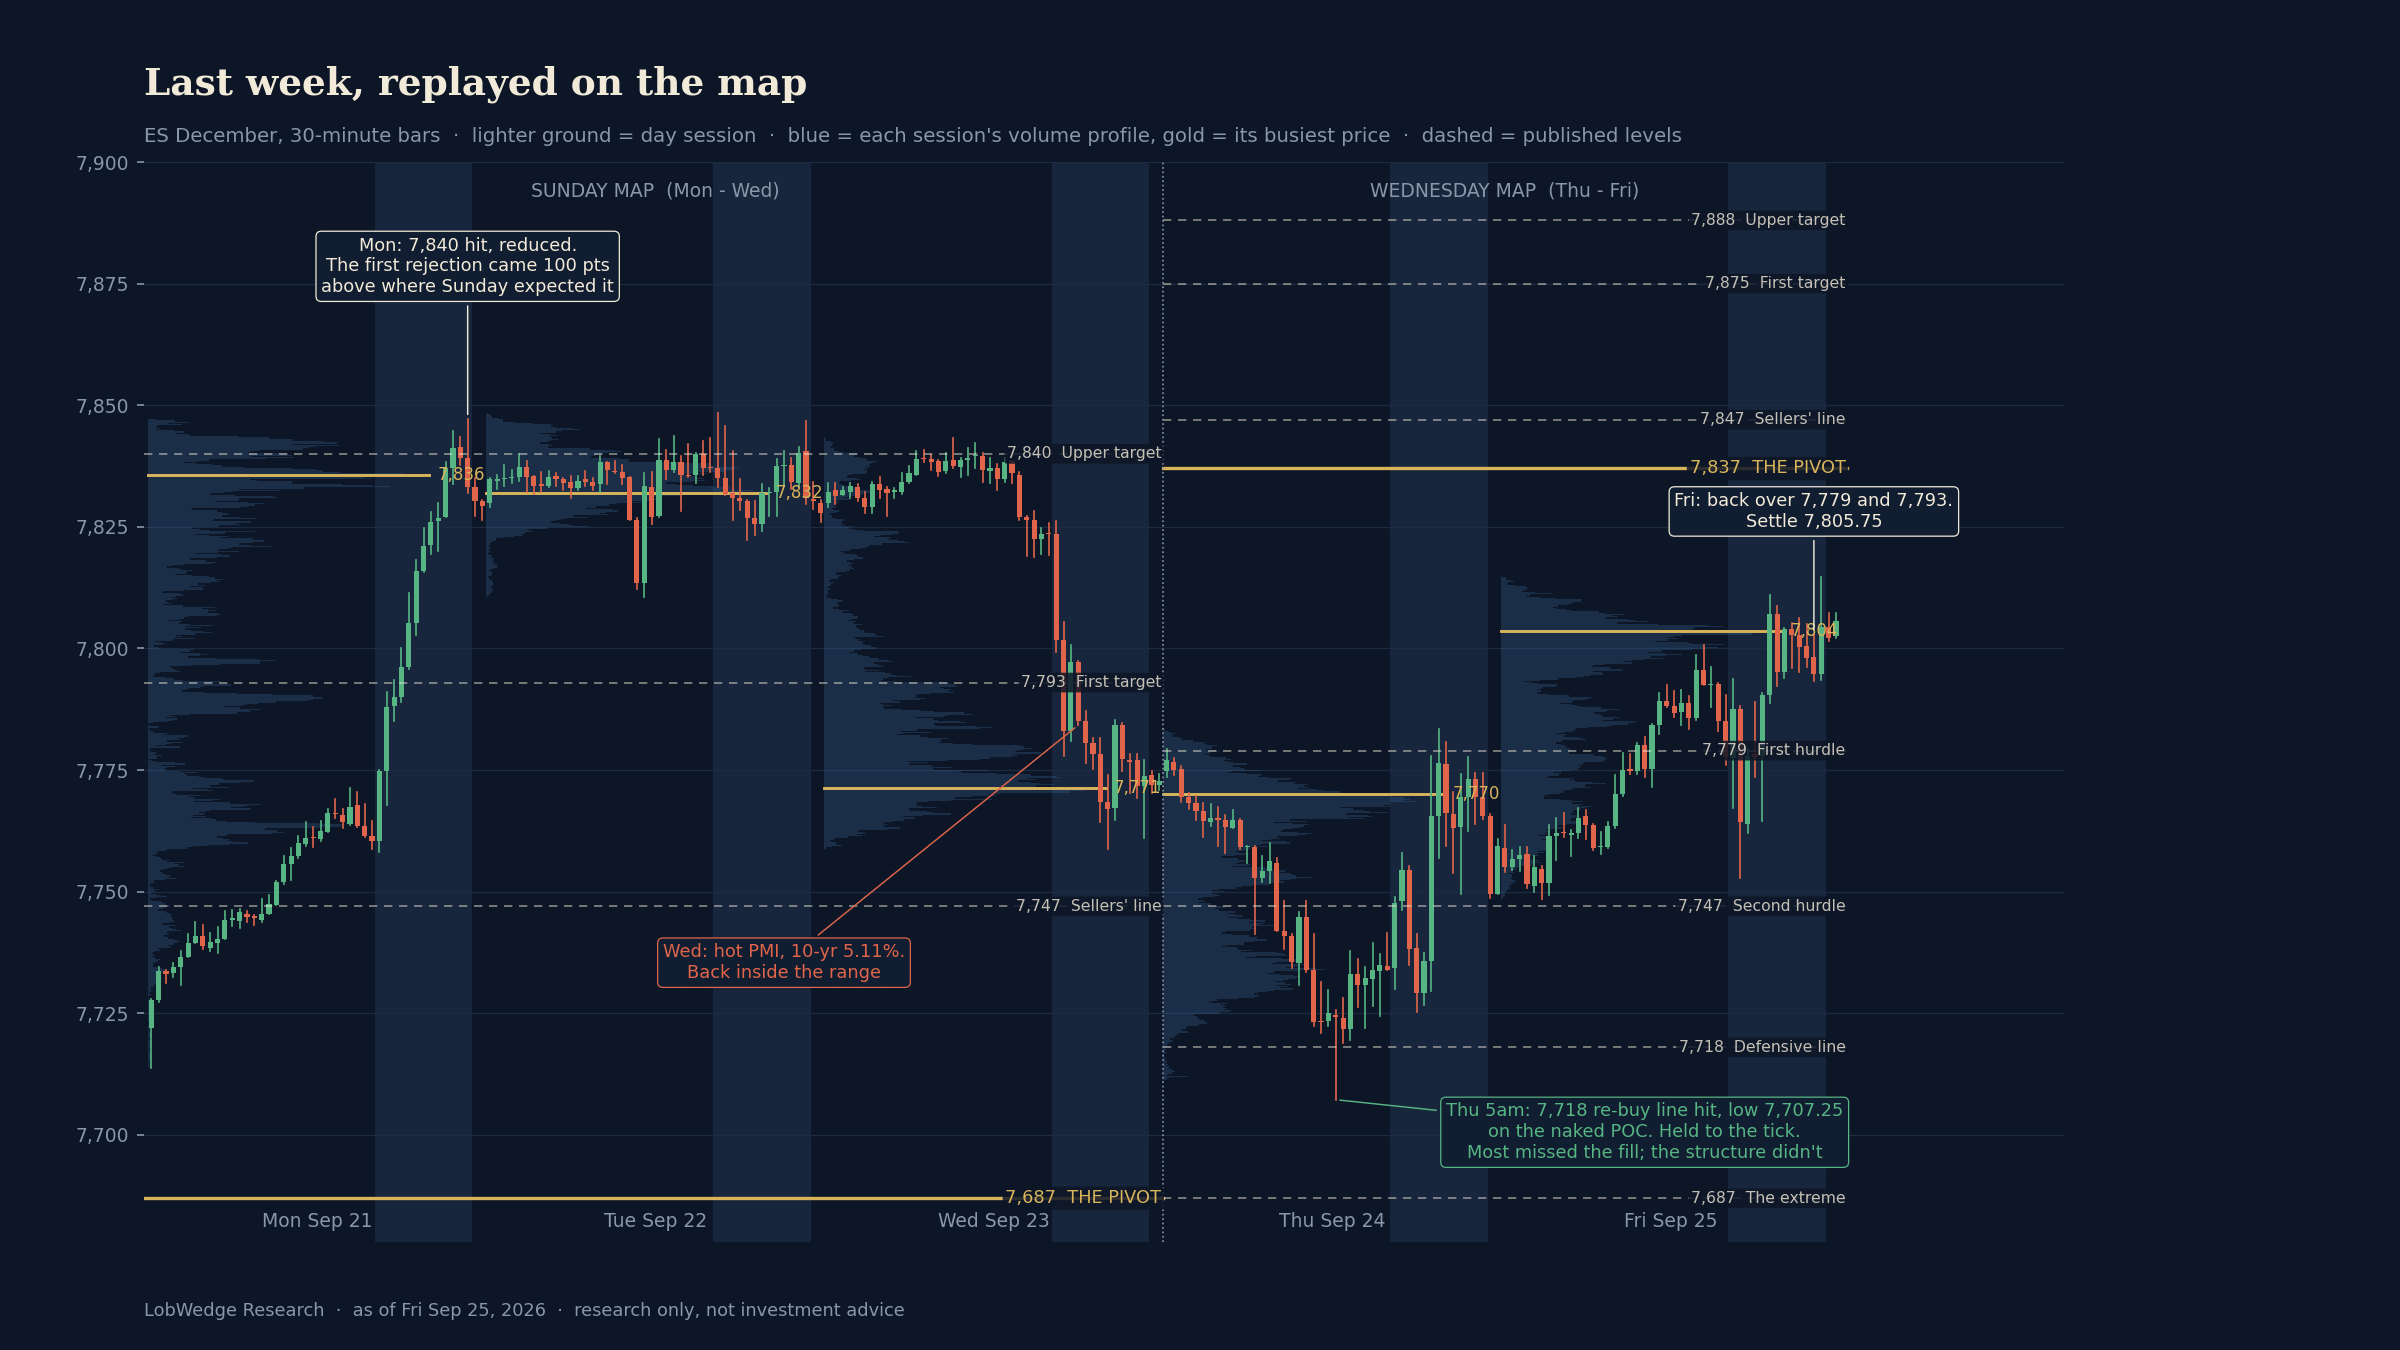
Monday went straight through 7,747, where Sunday expected the first rejection, and paid the 7,840 upper target by mid-afternoon; we reduced there, about 133 pts on that piece. Wednesday’s hot PMI put the 10-year at 5.11% and ES back inside the range, and Wednesday’s note re-marked the map with 7,718 as the re-buy line and 7,687 as the bigger add. Thursday’s pre-market hit 7,718, printed 7,707.25 on the naked level from 2 weeks earlier, and that was the low. The low printed at 5 a.m. Pacific, so most readers didn’t get it. The 7,687 add never filled. Friday closed 7,805.75, back over 7,779 and 7,793.
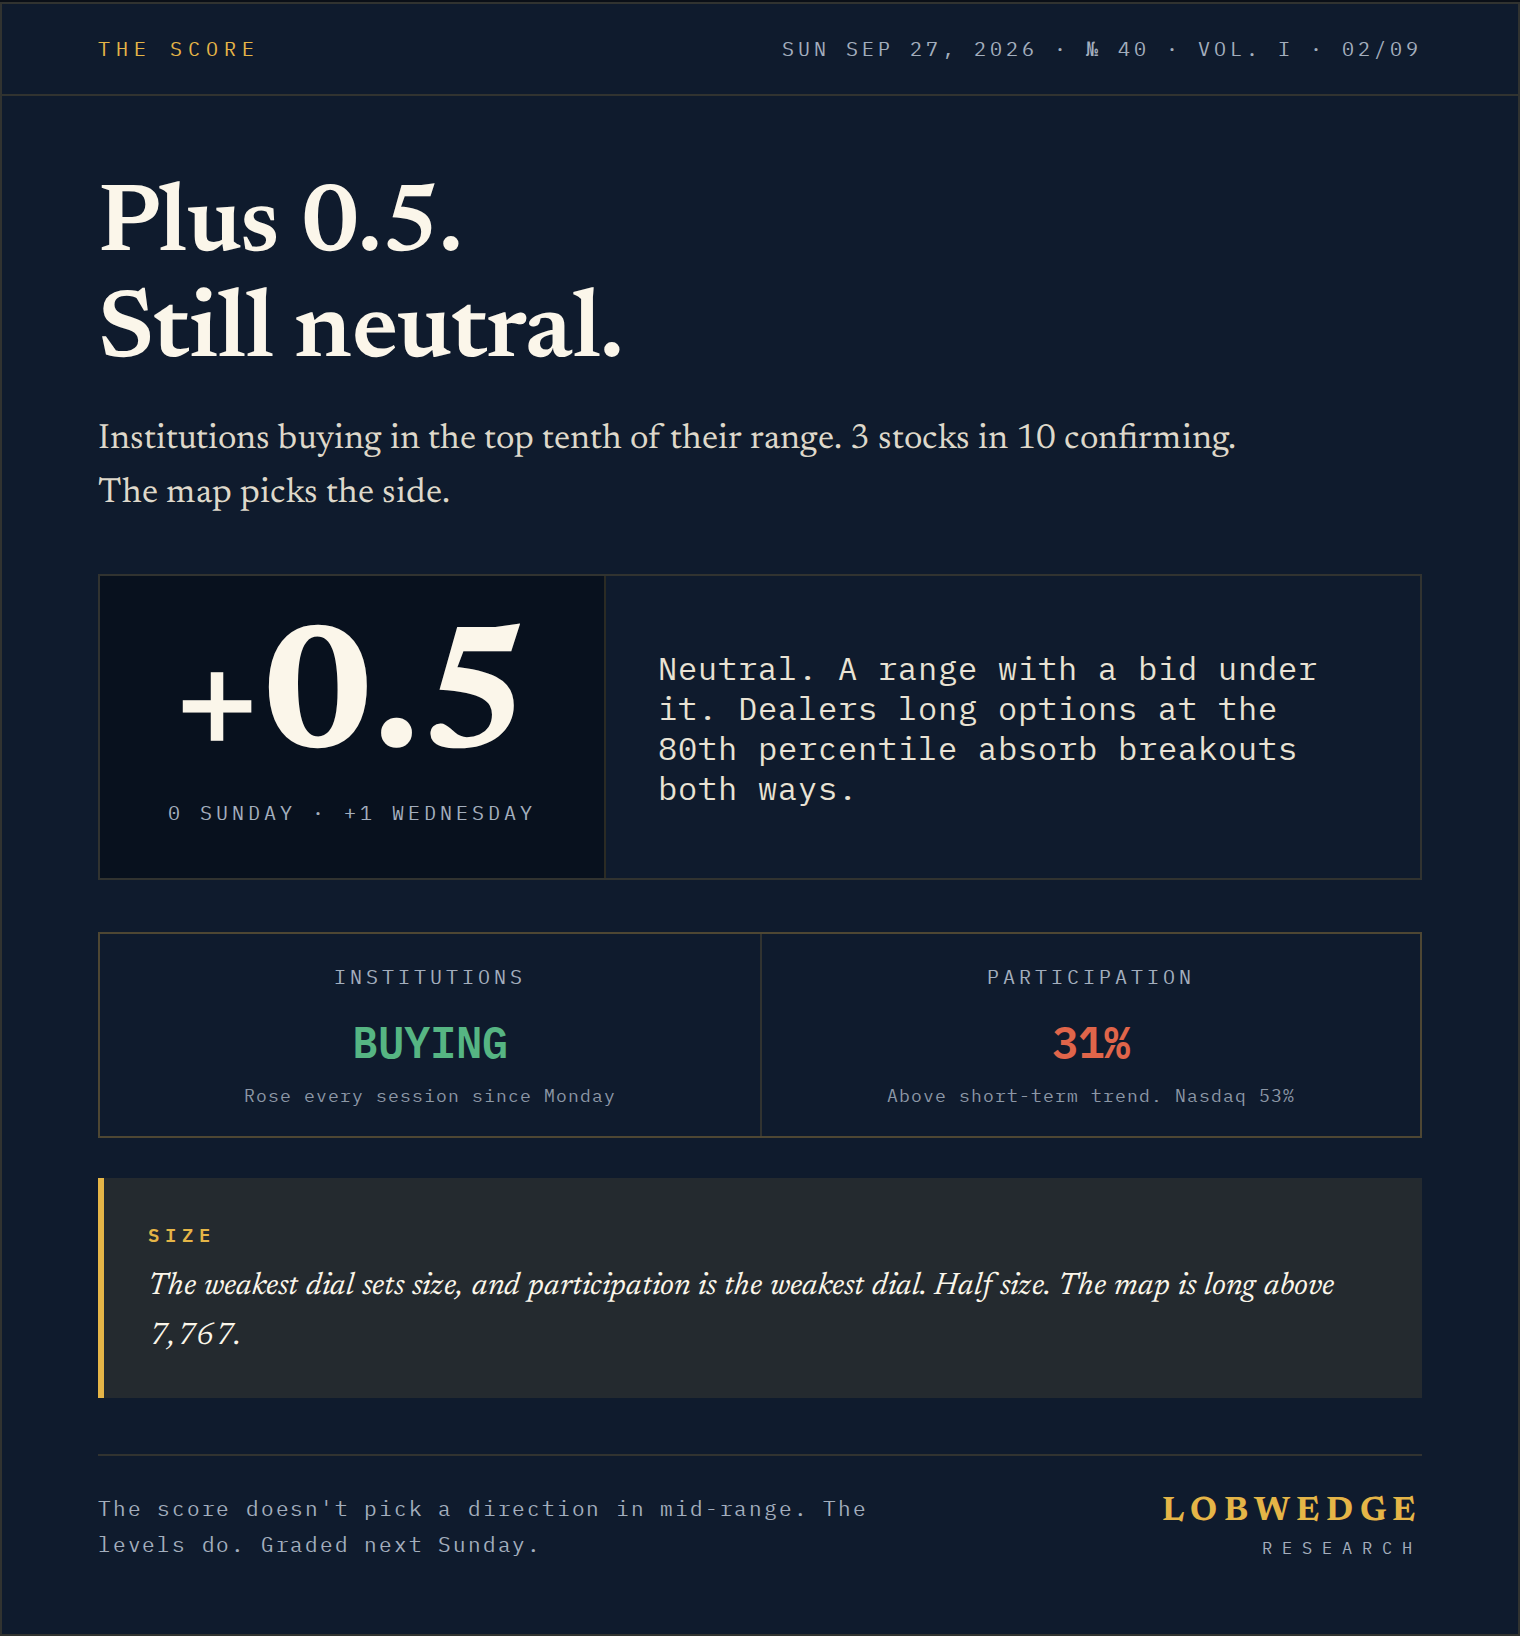
3 of 7 Sunday levels traded. The starter from 7,707.25 is open, up 98. The score went 0 Sunday, plus 1 after Wednesday, and the model prints plus 0.5 on Friday’s close: neutral, in the band where it doesn’t pick a side.
The learning moment. The re-buy printed pre-market and most of us missed it. That’s not a failure of the plan; the level held to the tick and the structure did its job. Missing a fill costs one entry. Chasing the bounce 60 pts higher costs the edge. The next entry is already written down, 7,767 to 7,780 on a touch. Time in the position at the right levels beats timing the low, and the legends each say it: Jones sizes for being wrong and lets the trend work, Druckenmiller waits for the setup and then presses it, Cohen keeps the loss small and the win big, Litowitz sizes so he can sleep through the print he can’t watch. Most of this is mental. A resting order at a level is an order you don’t have to be awake for, which is why the desk is building the automation: the map is keyed in Sunday, the orders wait at the lines, and the 5 a.m. print fills whether you’re up or not.
The framework
Every note runs the same chain, top down: what kind of market, what works in it, how big, where and when, what changes it. Each answer sets up the next, and it’s the chain the automation is built on.
What kind of market. A range with an uptrend under it and rates as the ceiling. The 10-year at 5.16% and the 30-year at 5.49% cap the multiple; they don’t end the trend, because earnings are still growing 25% to 30% and the multiple already came down from 23 to 19. Institutional buying by our gauge is in the top tenth of its range and rose every session since Monday, while 31% of stocks hold their short-term trend. Big money buying a market most stocks don’t confirm is a range with a bid, and that’s been the last 4 weeks.
What works in it. Buying leaders at their own averages and the index at its levels. Not breakouts, not laggards. The leaders are in 4 places, AI hardware and semis, security software, life-science tools, and the 2 platforms with a monetization story; the spots are below. What doesn’t work is anything that needs the broadening: equal-weight, small caps, utilities, financials, and the refiners we cut Wednesday.
How big. Half. The weakest dial sets size, and participation is the weakest dial. A neutral score doesn’t pick a direction, so the map does, and it’s long above 7,767.
Where and when. The levels below, bought on touches in the day session. The overnight is where headlines land; the day session is where they get decided. Rule 2 in the plan has the number.
What changes it. 2 prices on the index, 7,837 up and 7,767 down. 1 number on rates, 5.25% on the 10-year. 1 print on the leaders, Micron Wednesday. That’s the watchlist.
Levels
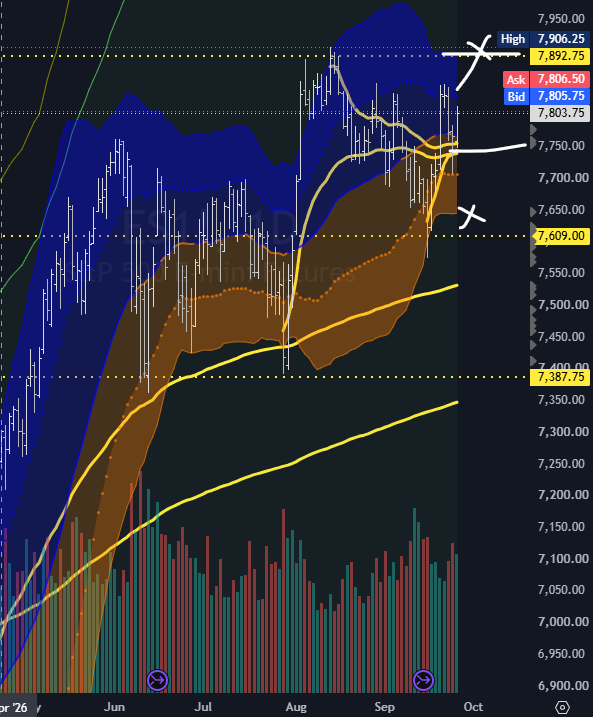
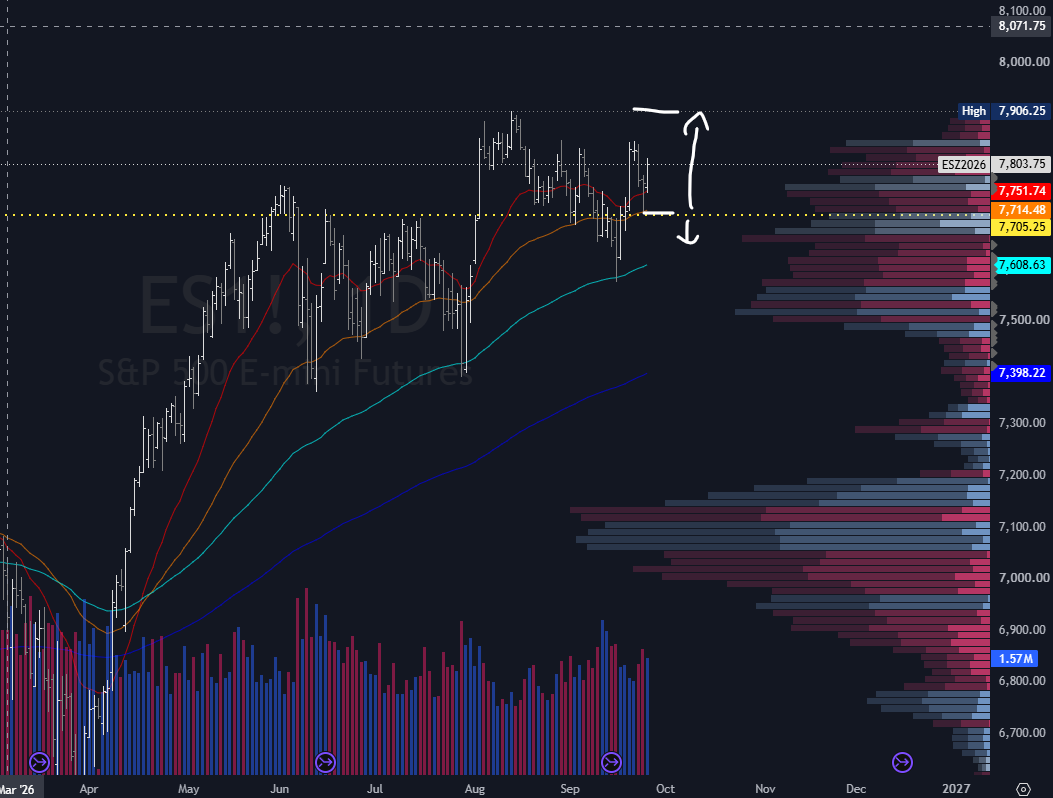
Trend first. ES is 62 pts over the 20-day at 7,743 and 80 over the 50-day at 7,726, and the 200-day is about 400 pts under anything on the map. All 3 are under price and rising.
The options market prices a weekly move of about 96 pts either way, 1.2%, so the band is 7,710 to 7,902. The band floor sits on the defensive line and the ceiling sits under the contract high, so the map and the options market agree on where the week lives.
7,887. Upper target. The second hurdle before new highs; the contract high at 7,906 sits behind it.
7,875. First target. The first hurdle above last week’s high. First scale.
7,847. Sellers’ line. Last week’s high, sold 3 times. A held close over it is a new leg.
7,837. THE PIVOT. Where Monday through Wednesday did its business, 32 pts over Friday’s close. A held close over it is the upgrade.
7,767. First hurdle. Thursday’s close and the swing low. Bullish above, cautious under. The add is a touch of 7,767 to 7,780 while the closes hold above it.
7,718. Defensive line. First support, the bottom of last week’s value, the band floor.
7,687. The extreme. The big area from the last 3 weeks. A close under it says a weaker market.
7,659. The trend line. Beyond the band. A close under it questions the uptrend since June.
What changes the score: a close over 7,837 that holds a second session, or a close under 7,767 that holds a second session.
7906  Contract high - only if 7,887 goes
7887  Upper target - second hurdle for new highs, band ceiling
7875  First target - first hurdle above last week's high
7847  Sellers' line - last week's high, sold 3 times
7837  THE PIVOT - close over, held, is the upgrade
7767  First hurdle - swing low; the add is 7,767-7,780 on a touch while closes hold
7718  Defensive line - first support, band floor
7687  The extreme - close under says weaker market
7659  Trend line - beyond the band; close under questions the June trend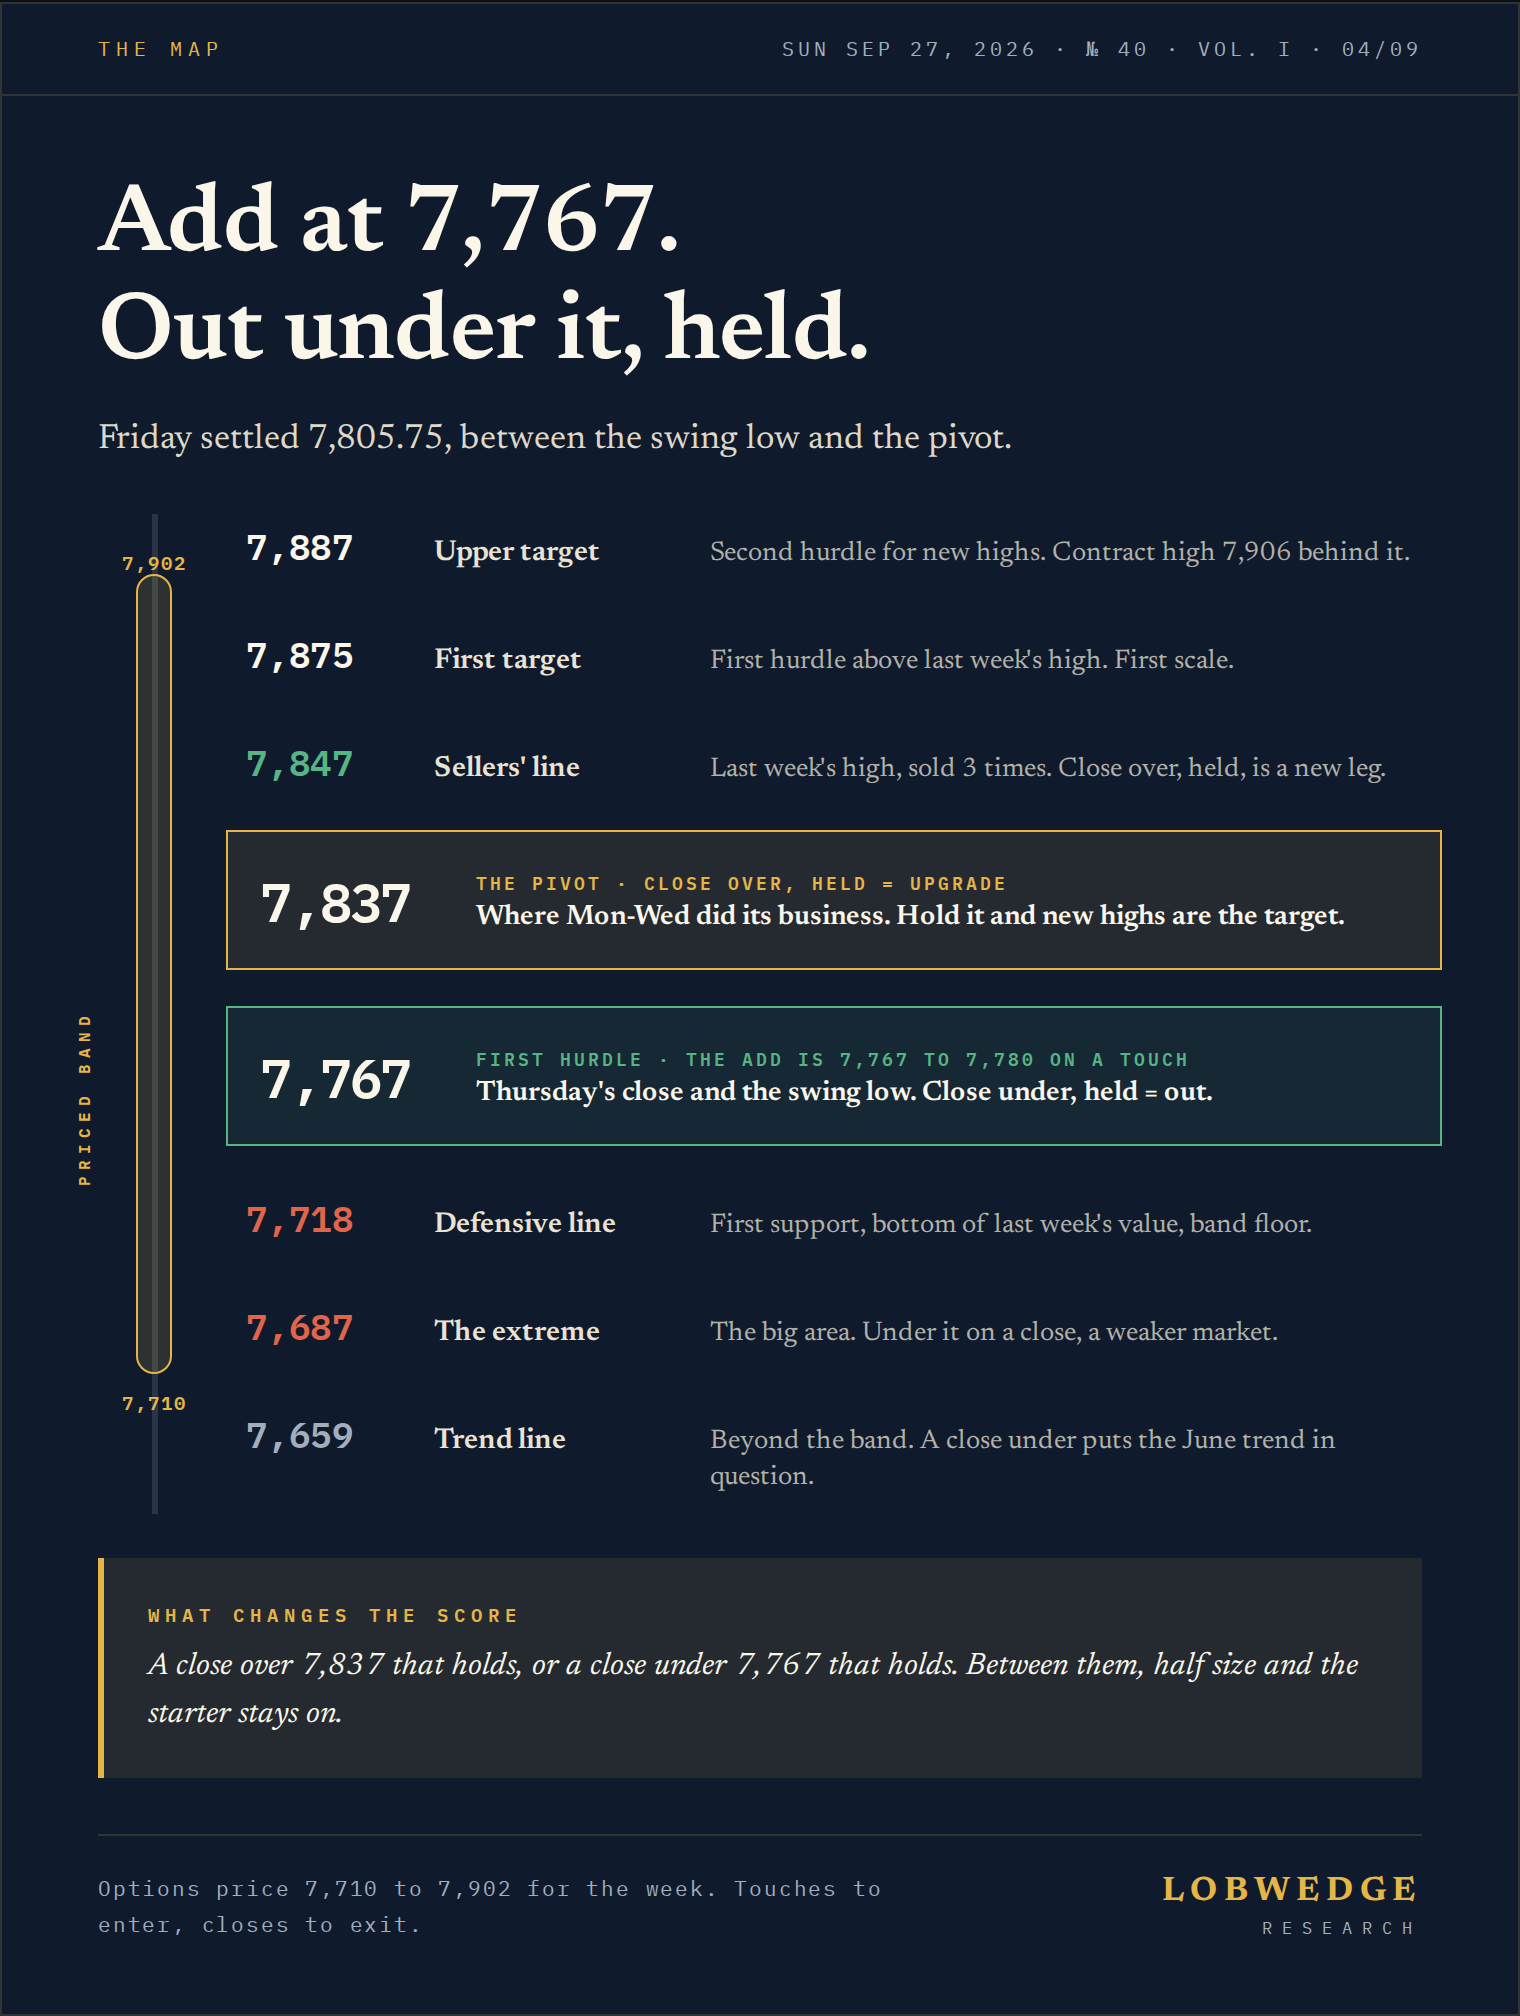
The plan
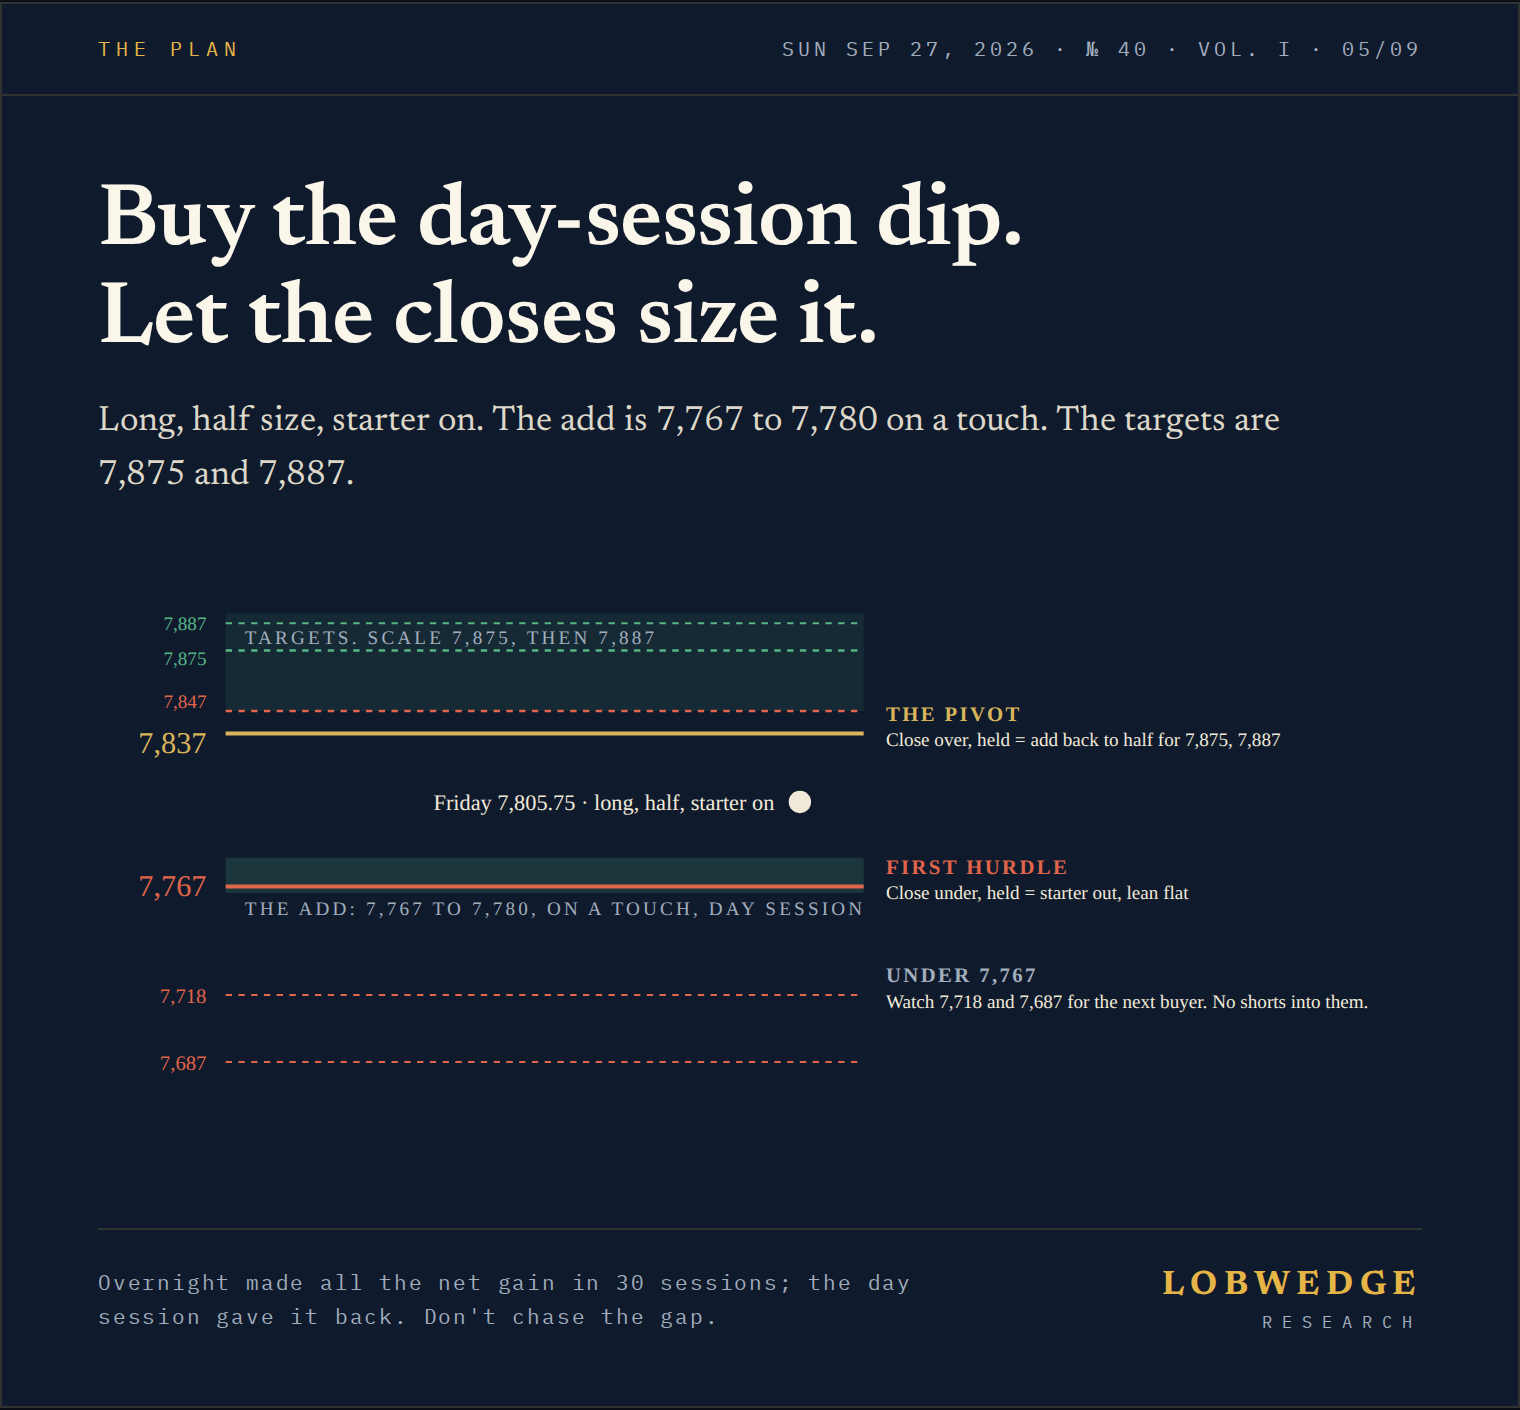
Long, half size, the starter from 7,707 on. Buy the dip, wait for the close.
One. The add is 7,767 to 7,780 on a touch, while the closes hold above 7,767. The coil sample says the normal dip from a Friday close like this one is about 0.8%, which lands on the 20-day just under the add zone, so the dip is the base case. If a close prints under 7,767, stop adding and let 7,718 and 7,687 decide.
Two. Don’t chase the overnight. In the last 30 sessions the overnight made all of the net gain, up 56 pts, and the day session gave back 124; the day went against the overnight 57% of the time. Most of what’s moved this market lately arrived as a “sources say” headline out of Washington, on Iran, tariffs or the Fed, and those land overnight. A gap up into 7,847 on a headline is where we wait; the day-session dip into 7,767 is where we buy.
Three. The closes decide size. A held close over 7,837 is the upgrade: add back to half for 7,875 and 7,887. A held close under 7,767 is the downgrade: the starter comes out, the lean goes flat, and we watch 7,718 and 7,687 for the next buyer rather than shorting into them.
The odds, from the 117-week sample: closes above last week’s high 50%, stays in the range 40%, closes under the 20-day 10%. The first 2 are long. Only the third costs anything, and the 7,767 close keeps it small.
The sizing chain, once: a neutral score with weak participation is half size. Every position starts as a starter until a level holds. Entries are touches. Exits and score changes are closes. The ratios are the framework; the dollars are yours.
The options
Front-week premium is fair, not cheap: 1.2% priced against a 1.8% range last week and a 2.6% median week in our data. We own it rather than sell it, defined risk, one structure per case.
The coil-up case. SPX call spread, 7,750/7,825 for Friday’s expiry, about 7,812 and 7,887 on ES, so the top strike sits on the upper target. A 29-pt debit for a 75-pt spread, $2,900 at risk for $4,600 at best. It replaces the futures add. The spot: an ES touch of 7,767 to 7,780 while the closes hold above 7,767.
The break case. SPX put spread, 7,700/7,650, about 7,762 and 7,712 on ES. An 11.6-pt debit for a 50-pt spread, $1,160 at risk for $3,840 at best. The spot: an ES close under 7,767 that holds. Directional once the starter is out, not a hedge beside it.
One bet each, never both at once.
Micron (MU), Wednesday after the close. Fundamentals first. $90B of revenue in the last 12 months, 3.5x a year ago, a 56% net margin, and $44 of earnings per share on a $1,082 stock: 24x trailing, 7x next year’s number, 44 of 48 analysts at Buy with a $1,515 target. That’s not a stock you bet against. The debate isn’t the quarter; it’s whether an 80% operating margin is a cycle peak or the new normal, and only Wednesday’s guide on memory pricing into 2027 answers that. Which is why beats get sold here: our file has MU beating on all 8 of its last reports and closing lower the next day 6 of 8, median move 7.4% against 8.6% priced this week. The number was never the question.
So the view is own it, and the execution is after the print. If it sells the beat, the dip toward its own average near 994 is the entry. If it gaps up on the guide, the leaders book pays. The only structure that fits the view is insurance: if you hold MU into the print, a 1,060/980 put spread for Friday, about a 24-pt debit for 80 wide, covers the beat-and-fade at a known cost. If you don’t hold it, you don’t need the spread; you need the dip.
The crowd
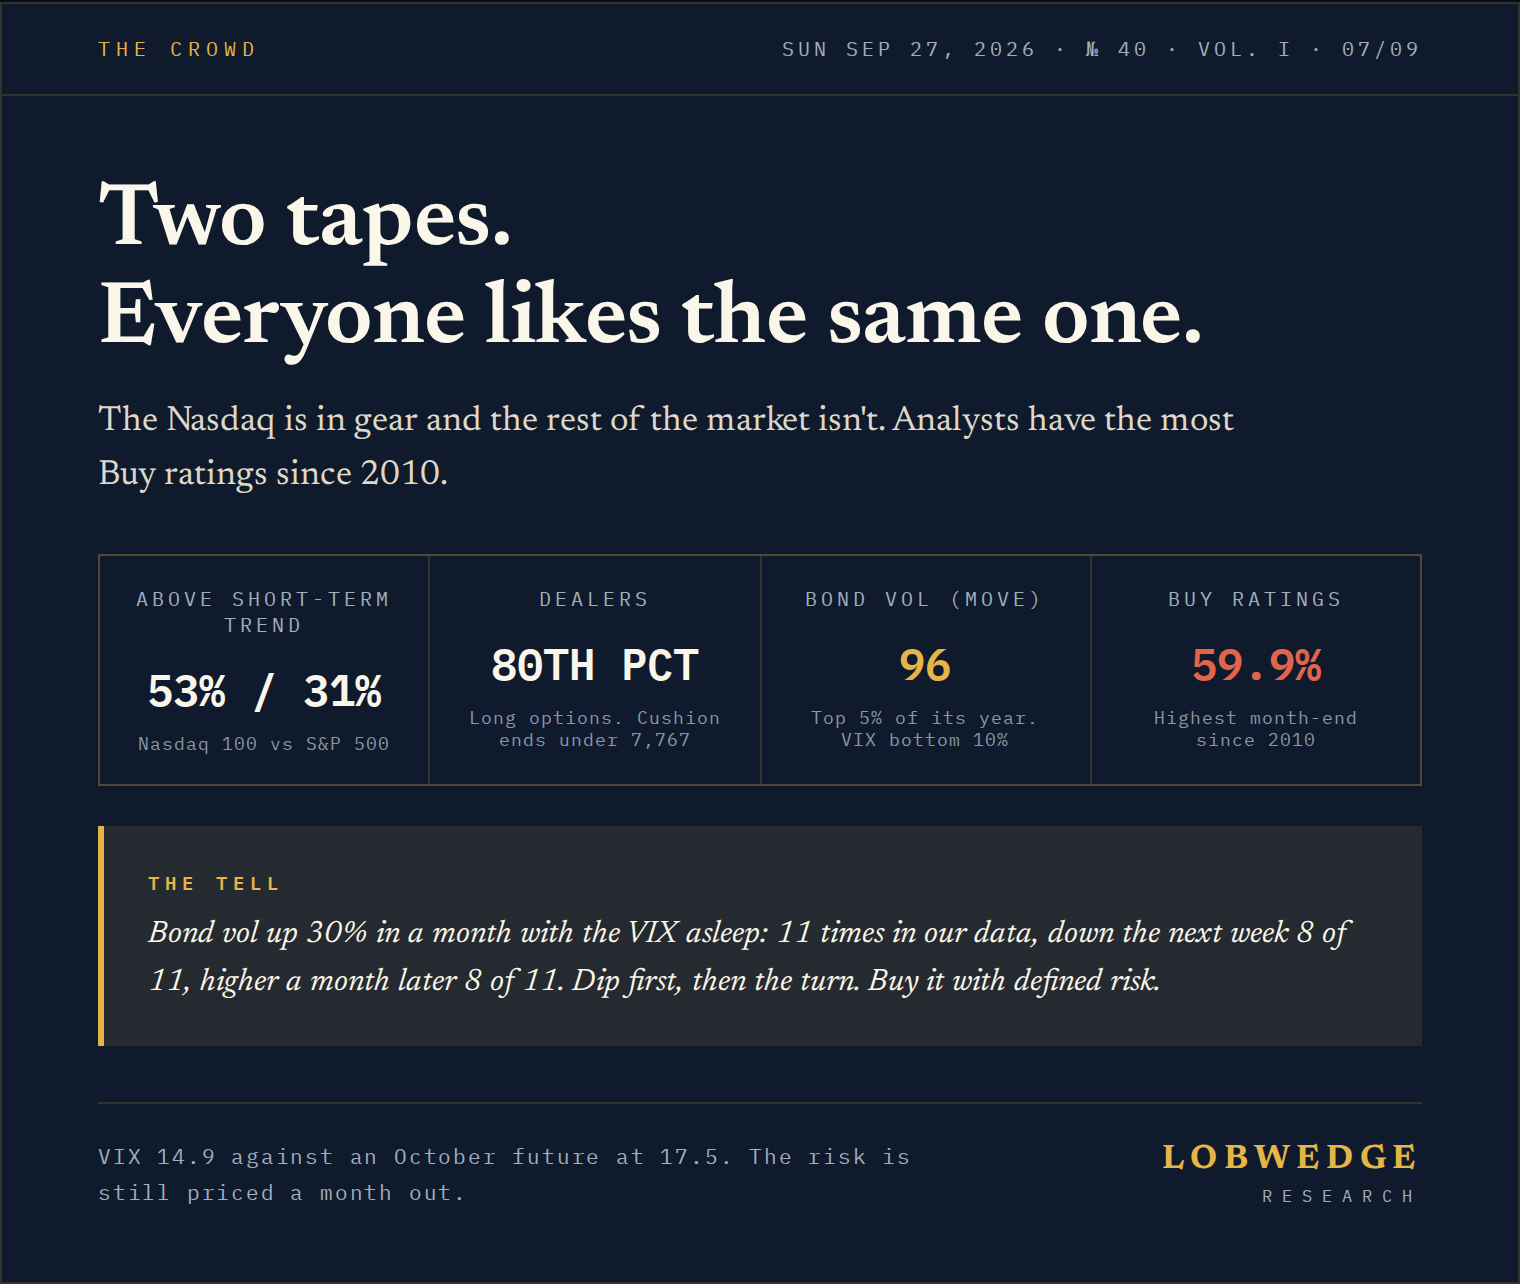
Two tapes: 53% of Nasdaq 100 names are above their short-term trend against 31% of the S&P 500. Dealers are long options at the 80th percentile of the year, the mechanism behind 4 weeks of range: they sell rallies and buy dips. Their cushion runs out just under 7,767; below it moves extend, which is why 7,718 and 7,687 sit close together.
Hedging is light: equity put/call 0.62, VIX 14.9 in the bottom tenth of its range, the October future at 17.5 still carrying the risk a month out. Buy ratings cover 59.9% of the S&P 500, the highest month-end share since at least 2010. The crowd already owns the leaders, which is why the buys go at the averages, not the highs.
The bond market is nervous and the stock market isn’t. The MOVE index, the VIX of Treasuries, closed 96, the top 5% of its year and up 38% in 20 sessions, while the VIX sits in its bottom 10%. Our 10 years say a high MOVE doesn’t change where ES goes; it widens how far the bad week can go: the bad-tenth week runs -3.6% against -2.1% when bond vol is calm. The sharper case, bond vol up 30% in a month with the VIX still asleep, has happened 11 times: the next week was down 8 of 11, the VIX jumped 20% or more in 4, and a month later the index was higher 8 of 11 with a median gain of 4%. Dip first, then the turn. Same answer as the coil sample, and one more reason to buy the dip with defined risk instead of selling premium into it.
The leaders, and where to buy them
Every name here passes 4 checks in this order: the earnings (is the business getting better), the trend (is price above its own averages), the crowd (who already owns it), and only then the structure. The buy price is the stock’s own 20-day average or the low that held. Nothing gets bought at a high.
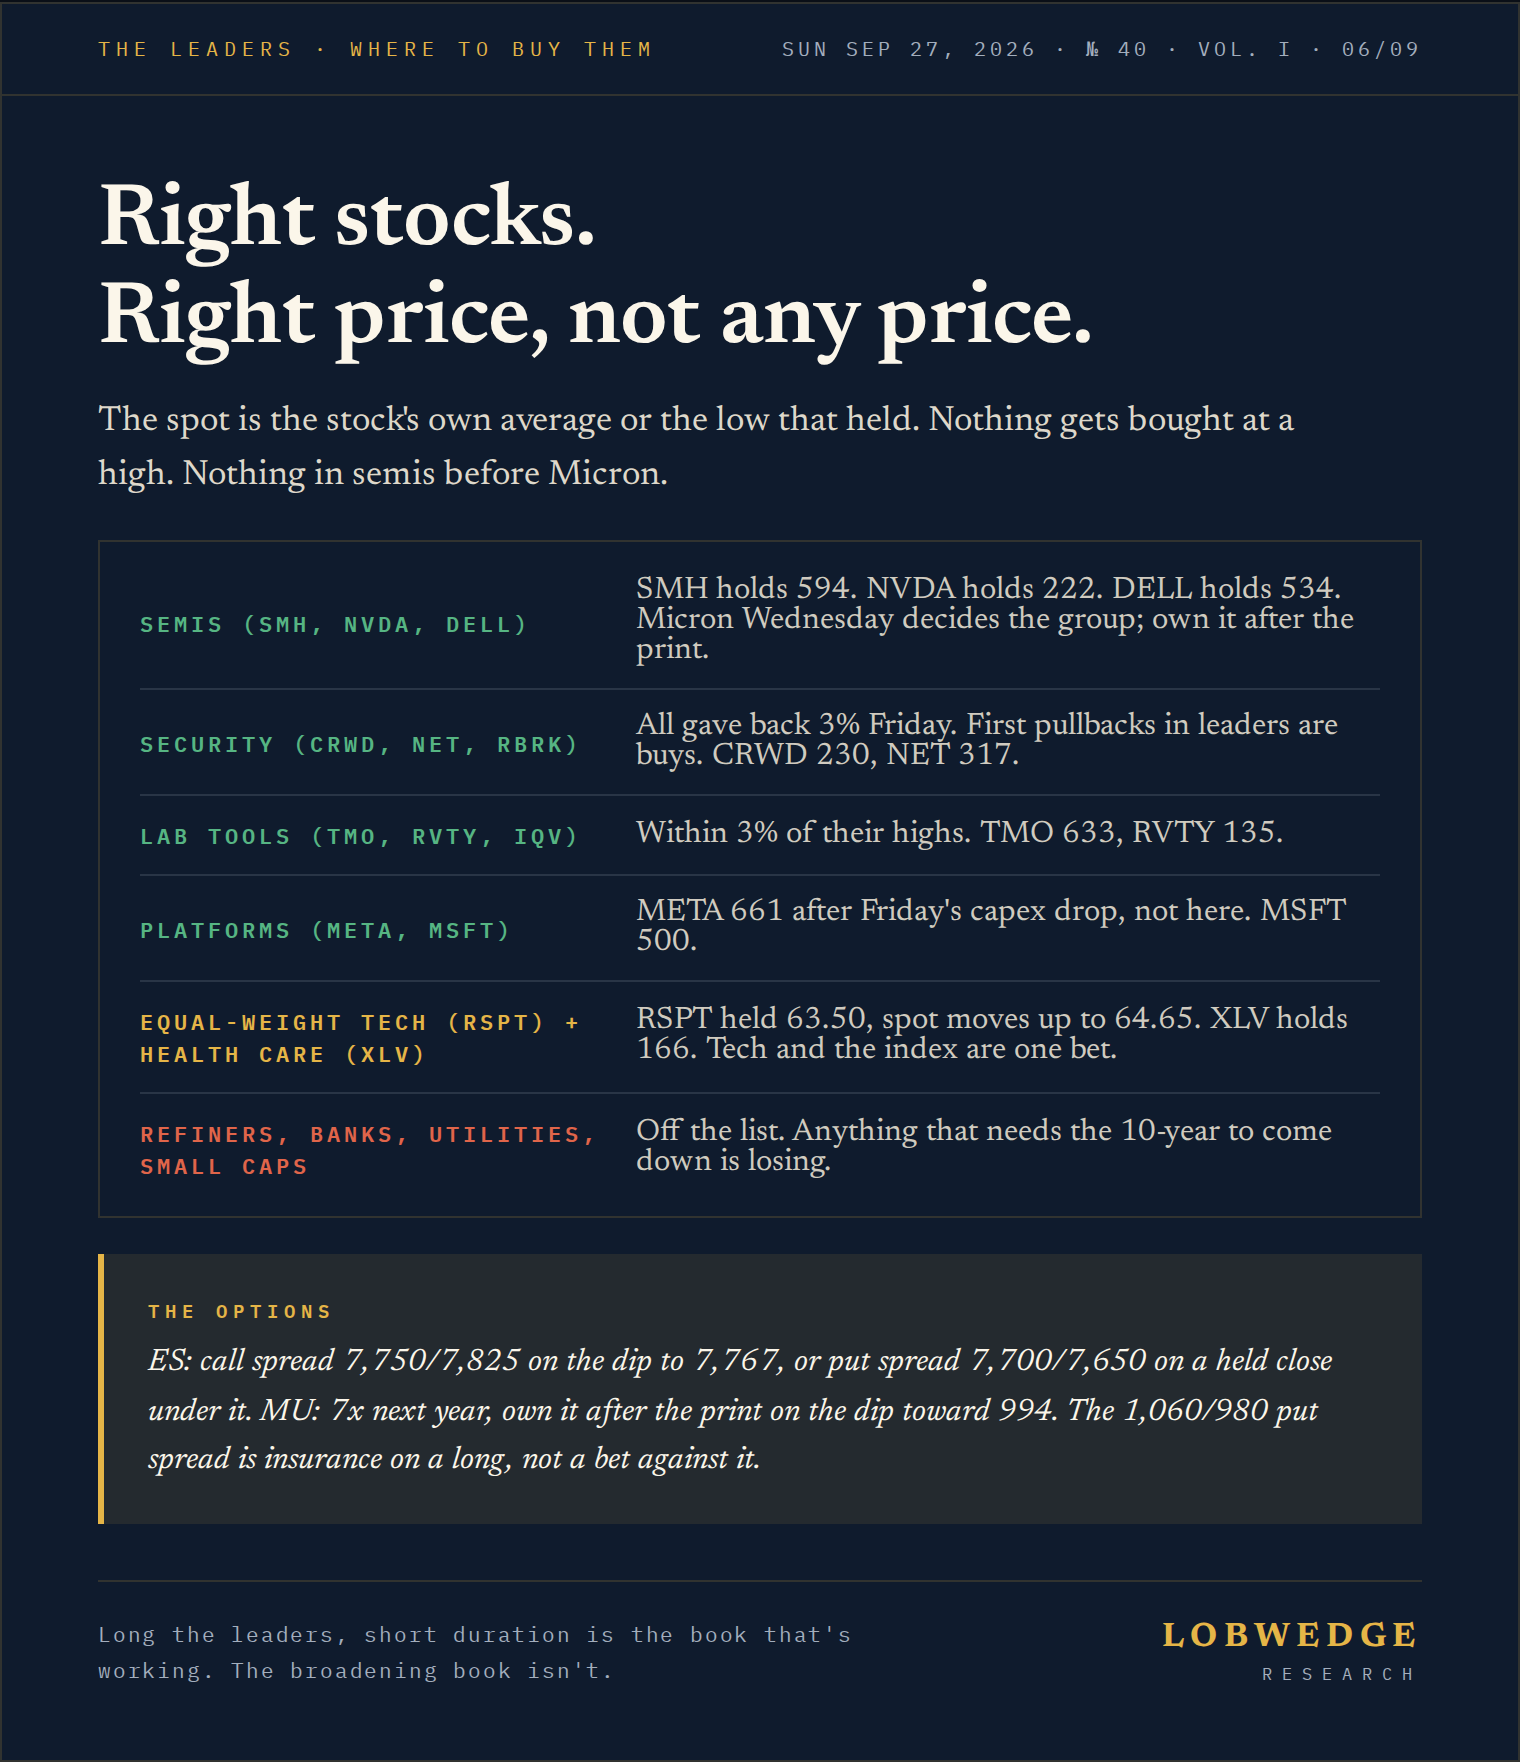
Semis. Micron’s print decides the group and nothing here gets bought before it. The semiconductor fund (SMH) 606.56; the spot is 594, Wednesday’s low. Nvidia (NVDA) 225 sits on its 20-day; the spot is 222. Dell (DELL) held 534 and that stays the spot. AMD at 630 is 100 pts over its average, on the list without a buy.
Security software. CrowdStrike (CRWD) 252.13, Cloudflare (NET) 349.02, Rubrik (RBRK) 109.55, all down 3% Friday with software. First pullbacks in leaders are buys. The spots: CRWD 230, NET 317.
Life-science tools. Thermo Fisher (TMO) 675, Revvity (RVTY) 151.11, IQVIA (IQV) 270.37, all within 3% of highs. The spots: TMO 633, RVTY 135.
The 2 platforms. Meta (META) 751.66 after a 3.3% Friday drop on capex scrutiny; the spot is 661, not here. Microsoft (MSFT) 516.17; the spot is 500.
Equal-weight tech (RSPT). 66.38, held 63.50; the spot moves up to 64.65. Tech and the index long are the same bet; size one, not both.
What’s working, and what isn’t
Earnings are why the leaders keep working: third-quarter estimates rose 1.3% during the quarter when they usually fall 2%, and the forward multiple is 19.2, under its 5-year average. Earnings went up and the price of them went down, which is why a dip in a leader is a buy, not a warning.
A book built on the leaders plus a short-bond hedge has paid for a month: tech (XLK) +8.6%, semis +9.4%, the long bond fund (TLT) -4.7%. Long the leaders, short duration, is the construction that’s working, and by the Goldman read it’s what the big hedge funds are running.
A book built on the broadening hasn’t: equal-weight -4.6% on the month, small caps -5.6%, utilities -8.8%, materials -7.1%, gold -7%, XLF still under the 56.85 it needed. Anything that needs the 10-year to come down is losing. Health care (XLV) is the one dip-buy outside tech that held its line, 170.70 over 166; hold it. The refiners led the summer and don’t anymore, VLO and MPC 6% off in a week with crude at $92. They stay cut.
The week
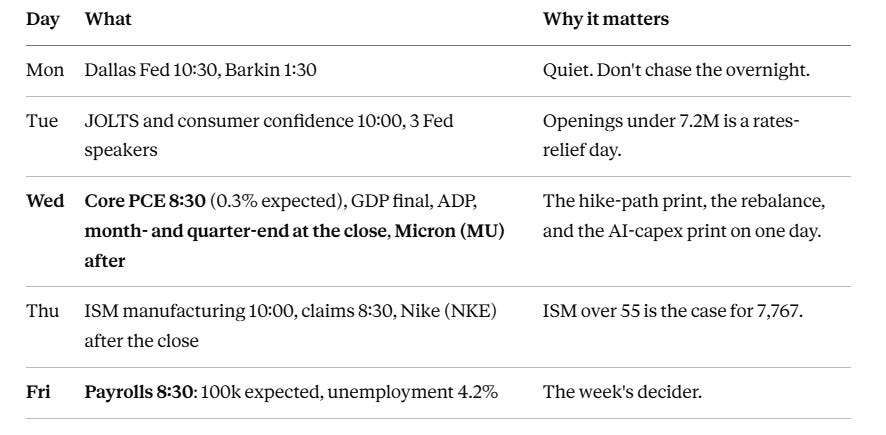
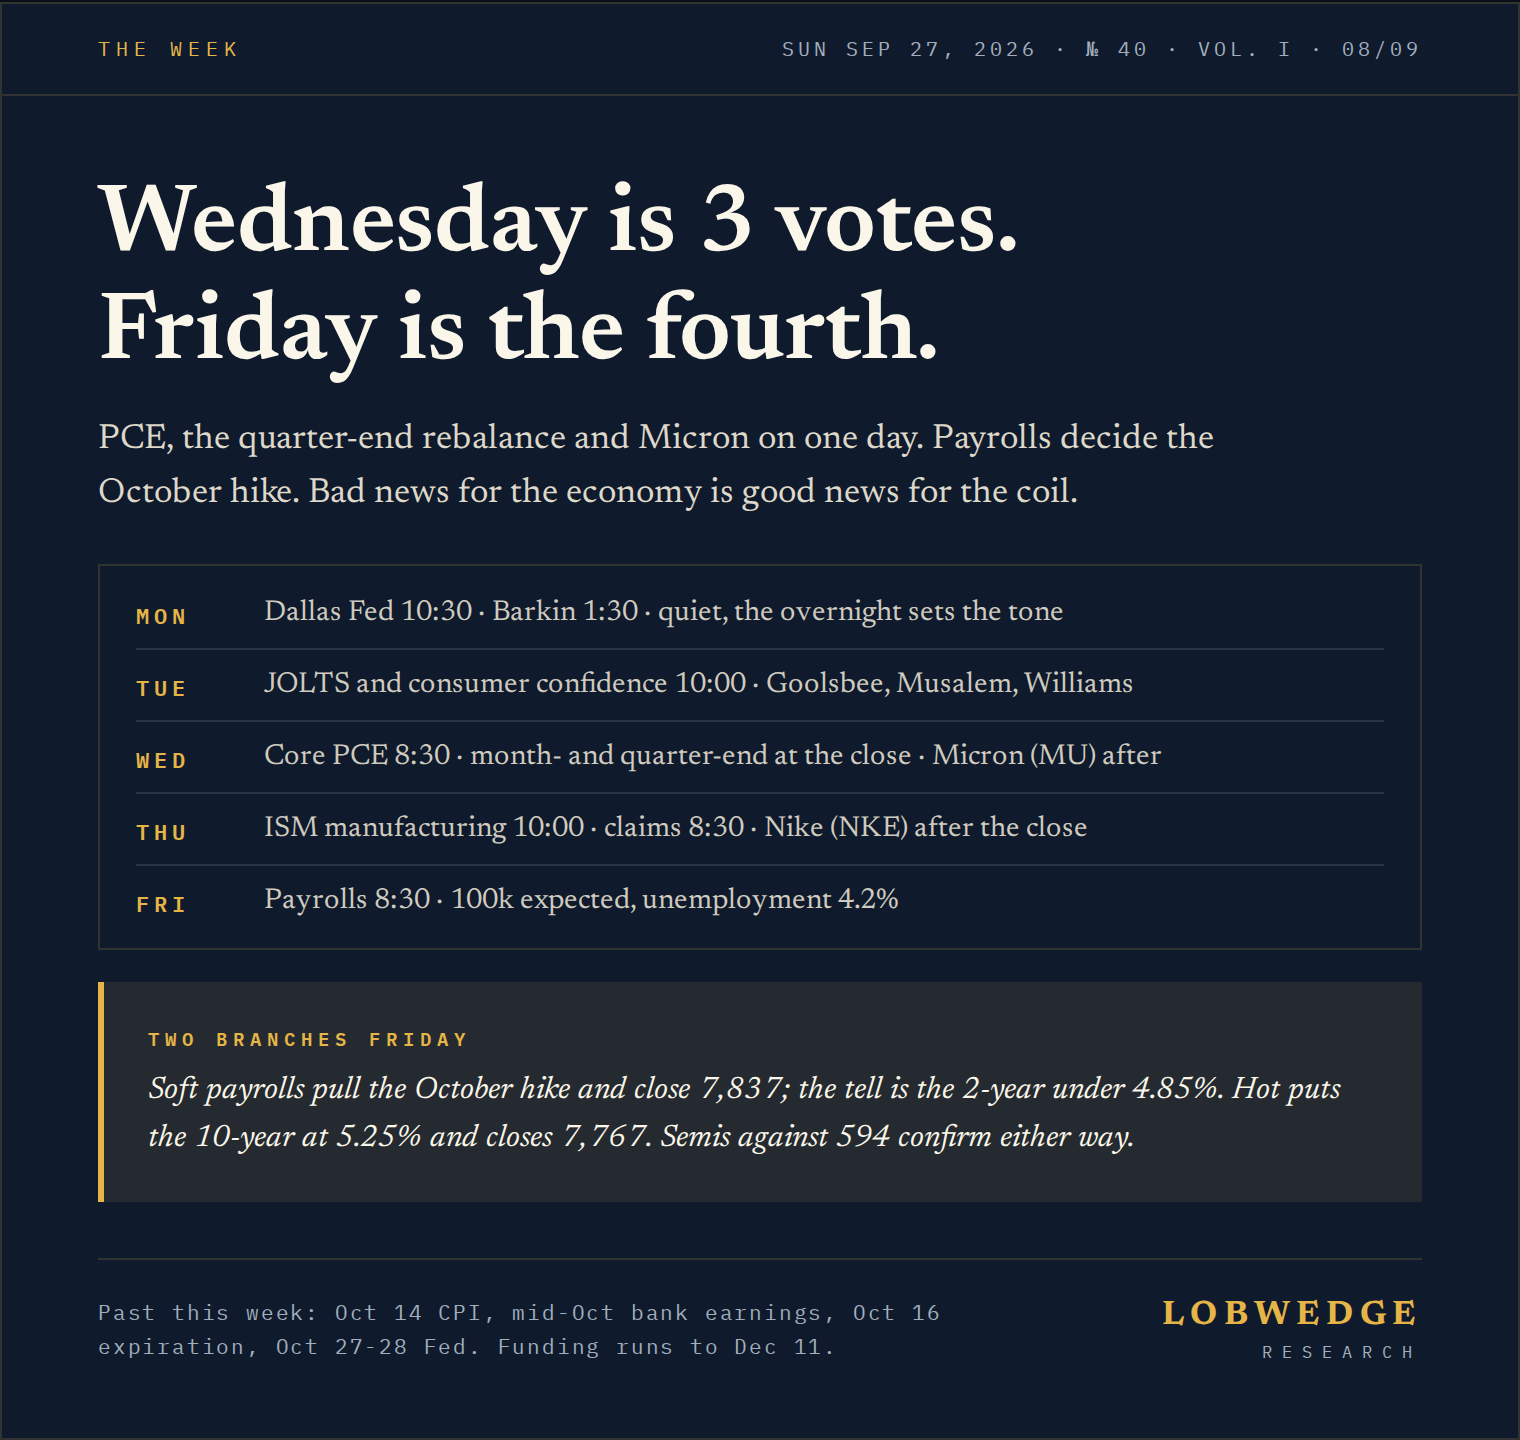
Two branches for Friday, and the second-level read. Soft payrolls, under 100k with unemployment at 4.2% or worse, pull the October hike out of the price and that’s the close over 7,837; the tell is the 2-year under 4.85%. Hot, 150k or better, puts the 10-year at 5.25% and that’s the close under 7,767; the tell is utilities and small caps leading down. The part that trips people up: bad news for the economy is good news for the coil this week, because the market is trading the Fed, not the economy. Either way, semis against 594 confirm.
Wednesday. Quarter-end is mechanical: pensions rebalance out of a quarter where stocks beat bonds, so the last hour can sell for reasons that have nothing to do with the tape, and buybacks stay in blackout until mid-October. A quarter-end dip into 7,767 is the same add as any other, not news. Micron is the first big AI-hardware print since the market started auditing capex; a beat with a raise keeps the leaders’ bucket open, a guide-down closes it.
Past this week, each event is a vote on one of our 2 theses: rates cap the multiple but don’t end the trend, and AI capex keeps the leaders leading. Oct 5 ISM services and Oct 14 CPI vote on the first. A hot print doesn’t hurt because the economy is strong; it hurts because it pushes the 10-year toward 5.25% and makes the October hike certain, and the selling shows up in the leaders first because that’s where the gains are. Oct 7 Fed minutes: the more dissent on the hike, the more room the coil has. Bank earnings from mid-October are the rates vote in reverse: banks earn at these yields, so if XLF can’t clear 56.85 on good numbers, stop waiting for the broadening this quarter. Oct 16 is monthly expiration, where the dealer cushion resets; pins tend to break the week after.
Oct 27-28 is the Fed, and it only moves us if December’s guidance changes; big-tech capex prints land right after, and that’s the capex vote in full. Government funding runs through Dec 11, so Sep 30 isn’t a shutdown risk. Seasonally the 2 weeks after this one were up 7 of 10 with a median gain of 1.4%; if Thursday’s dip was the September drip, early October is where the turn starts.
Iran. Trump rejected Iran’s Hormuz offer this weekend but said more talks are coming. Crude is $92, down from $110. Re-checked Monday morning before this goes out.
The close
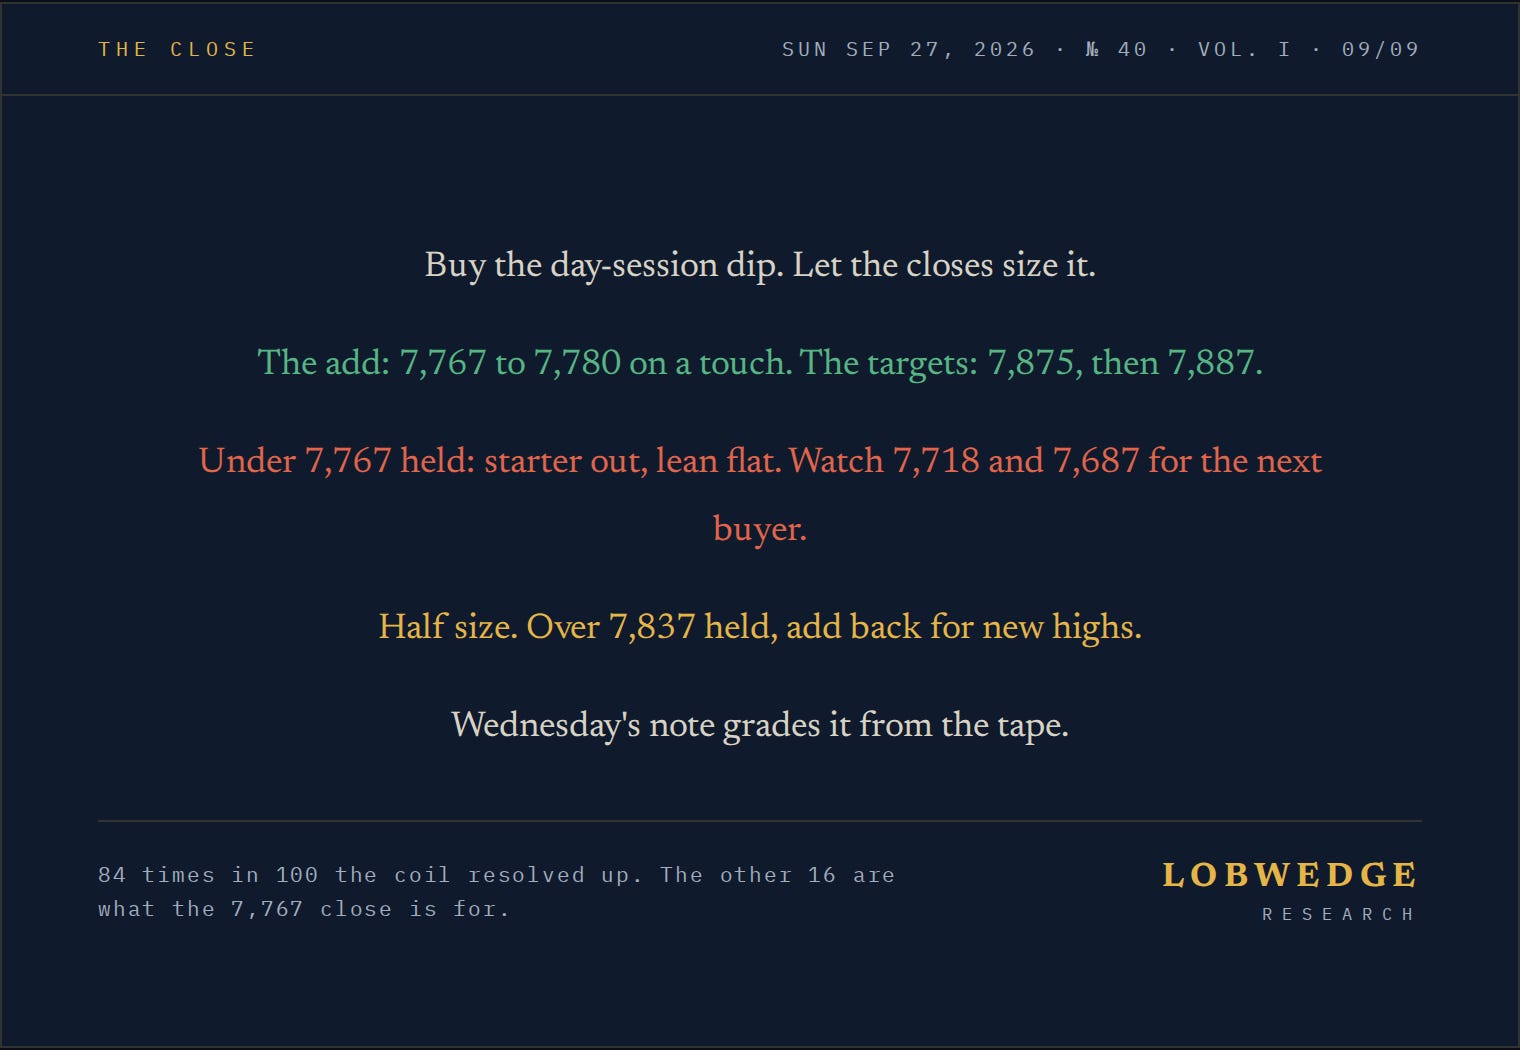
Long, half size, the starter from 7,707 on and up 98. The add is a touch of 7,767 to 7,780 in the day session, not on the overnight gap. Over 7,837 held is the upgrade to 7,875 and 7,887. Under 7,767 held takes the starter out. The coil resolved up 84 times in 100 in our data; the other 16 are what the 7,767 close is for.
Wednesday’s note grades it from the tape.
Research only. Not investment advice. Futures and options involve substantial risk of loss. The author may hold positions in securities mentioned.